Qovery Observe is Here: Your Deployments, Your Data, Your Visibility


Qovery Observe is Here: Your Deployments, Your Data, Your Visibility
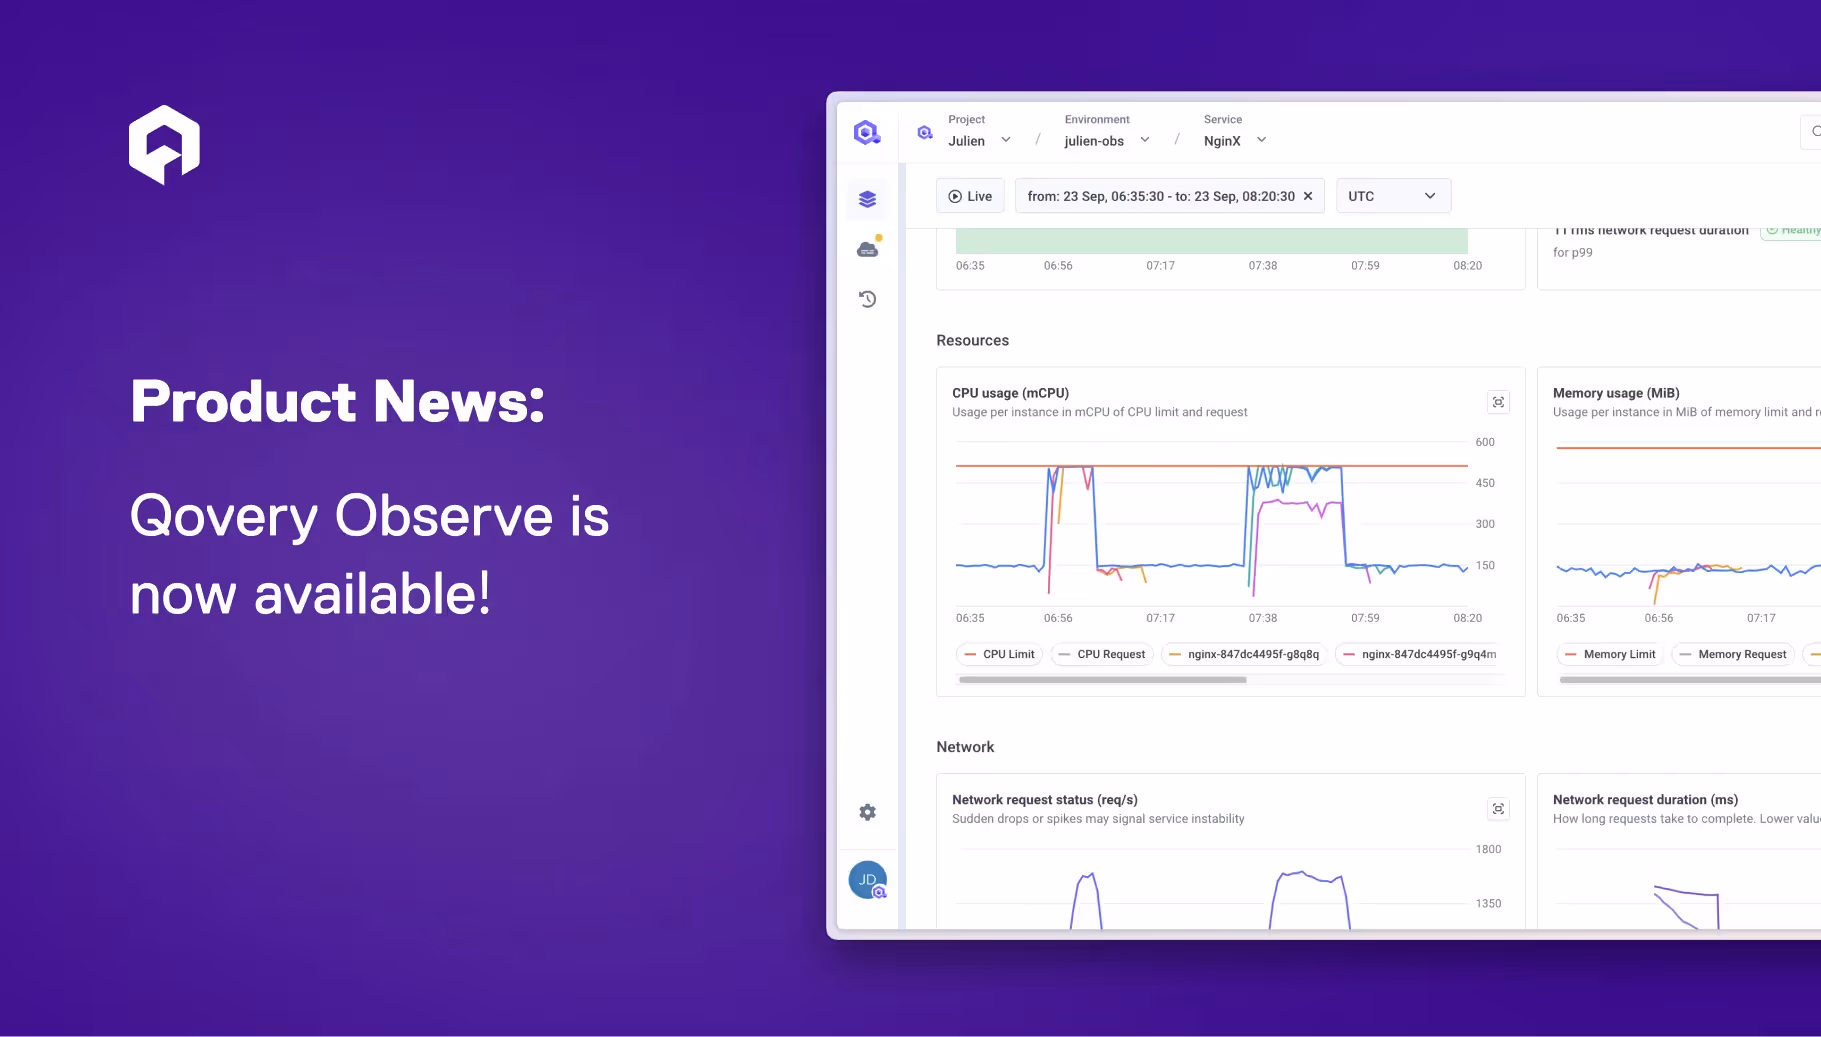
We're thrilled to announce that Qovery Observe is now available to all users.
After several weeks of our early access program (EAP) with five pilot customers, we are thrilled to officially launch Qovery Observe (our observability feature). These customers got exclusive early access to the feature and worked closely with our product team for one month. Their real-world use cases, continuous feedback, and hands-on testing allowed us to improve performance, add the right features, and refine the user experience to be as intuitive as possible.
The Observability gap: Why we built Qovery's Observe Solution
Engineering teams often face these difficult choices when it comes to monitor their application:
- Third-party SaaS tools
- Feature-rich but expensive, with data leaving your infrastructure and weak correlation with your deployed services.
- DIY monitoring stacks
- Flexible but complex to set up, hard to maintain, and time-consuming to scale.
- Qovery Observe
- The best of both worlds: built-in, zero maintenance, and tightly integrated with your deployments.
.png)
What You Get with Qovery Observe:
- Instantly check service health to know if your applications are running as expected.
- Monitor key metrics like CPU, memory, and network usage for every service.
- Access detailed logs with up to 90 days of retention to quickly troubleshoot issues.
- Track events from both Qovery and Kubernetes, giving you a correlated view of deployments, scaling, pod failures, and more.
"Qovery’s new observability feature provides real-time visibility into cluster performance, pod allocation, and scaling behavior, making it easy to monitor deployments and resource usage across staging and production environments." Clément Garbay, Co-founder & CTO at Hyperline
Built with our customers, for our customers
Qovery Observe was not built in a vacuum, it was shaped directly with our users.
During our EAP, we onboarded five customers who tested the feature in their own environments before anyone else. Over the course of a month, we:
- Collected feedback from real-world usage.
- Added new functionalities requested by our pilot users.
- Tuned performance to handle production workloads.
- Improved the UX with concrete suggestions from engineers and operators.
This collaborative approach helped us ensure that Qovery Observe is not just powerful, but also developer- and ops-friendly.
"Qovery Observe feature has been really valuable as a quick way to observe service performance at a glance. Being able to immediately spot failing deployments or spikes in memory usage is helpful, and I especially like the pod allocation dashboard for understanding how auto-scaling behaves in our environment." Nick Roberts, Senior Developer at Greektrack
What’s next
We’re just getting started. Today, Qovery Observe is available for applications and containers running on AWS clusters.
Coming soon:
- Support for Scaleway, GCP, and Azure clusters.
- Extended observability for Jobs, Managed Databases, and Helm charts.
- Even more advanced metrics and visualization capabilities.
Stay tuned: this is only the beginning of a stronger, more integrated monitoring experience inside Qovery.
Get started today!
Qovery Observe is now available for all customers. Request access directly in your Qovery console from one of your service monitoring tab:
Stop wasting time juggling tools and dashboards. With Qovery, observability lives right where your deployments are.
👉 Available from $299/month

Suggested articles
.webp)