Blog
Product
Observability
5
minutes

Announcing Qovery Observability: the simplest way to understand your application

We are thrilled to announce the next major milestone in our platform vision: Qovery observability! Qovery Observability is our new product, ready to give you the fastest way to gain a crystal-clear, unified understanding of your application and infrastructure. Fully managed, you keep the data, no more tool switching. Coming soon!
Alessandro Carrano
Head of Product
Summary
Twitter icon
linkedin icon

What are we talking about

This is our developer-first observability tool that brings everything you need into a single, unified view, completely integrated into our platform.

Qovery Observability - application visibility right within the Qovery console

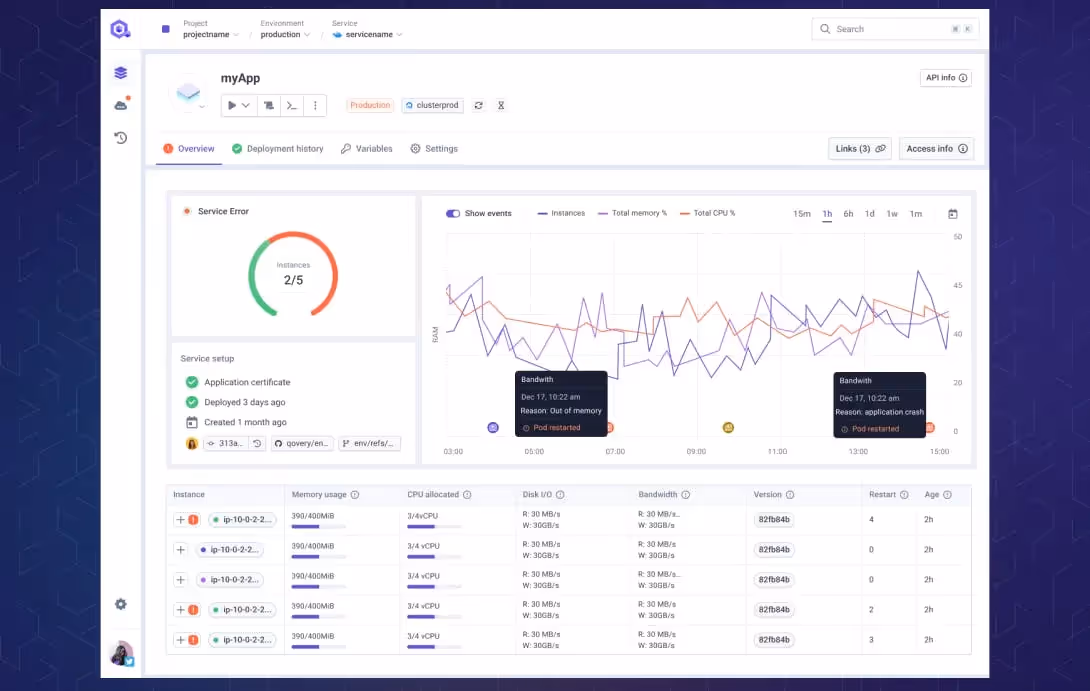
Thanks to the work we’ve been doing over the past years on our infrastructure management and CI/CD product, you can trace an issue from a failing pod to a recent configuration change, a network spike, or a service deployment, and even get alerted before customers notice anything without switching tabs or chasing down disconnected dashboards.

It is fully integrated into our platform and it provides metrics, events and logs across your entire stacks in a clean, powerful interface that lets you move from high-level views to granular details in seconds.

And the best part? It’s fully managed. No maintenance, no glue code, no integration headaches. Just one click and you get the data all in one place.

Why are we doing this

Multiple great solutions have been created over the past years around observability in DevOps, but they all have drawbacks. Here are the options today:

Option 1: Commercial monitoring tools (Datadog, New Relic, etc):

While installing these solutions with Qovery is a 5-minute job, they offer no seamless integration with your existing tooling and processes: important data and actions are spread across multiple boards/tools (logs, metrics, deployments, application configuration, etc), and it becomes hard to correlate them. Moreover, you lose control of your data (since it is stored outside of your infrastructure), and one of the most frustrating parts is the pricing unpredictability.

Option 2: Open source monitoring tools (Grafana/Prometheus, Alertmanager, etc) :

While they come for free on paper, installing and maintaining these solutions becomes pricier when you’re not an expert. This usually translates into involving/hiring a DevOps engineer who will install and maintain the stack for you. Last but not least, like commercial monitoring tools, these solutions do not offer seamless integration with your existing tooling and processes.

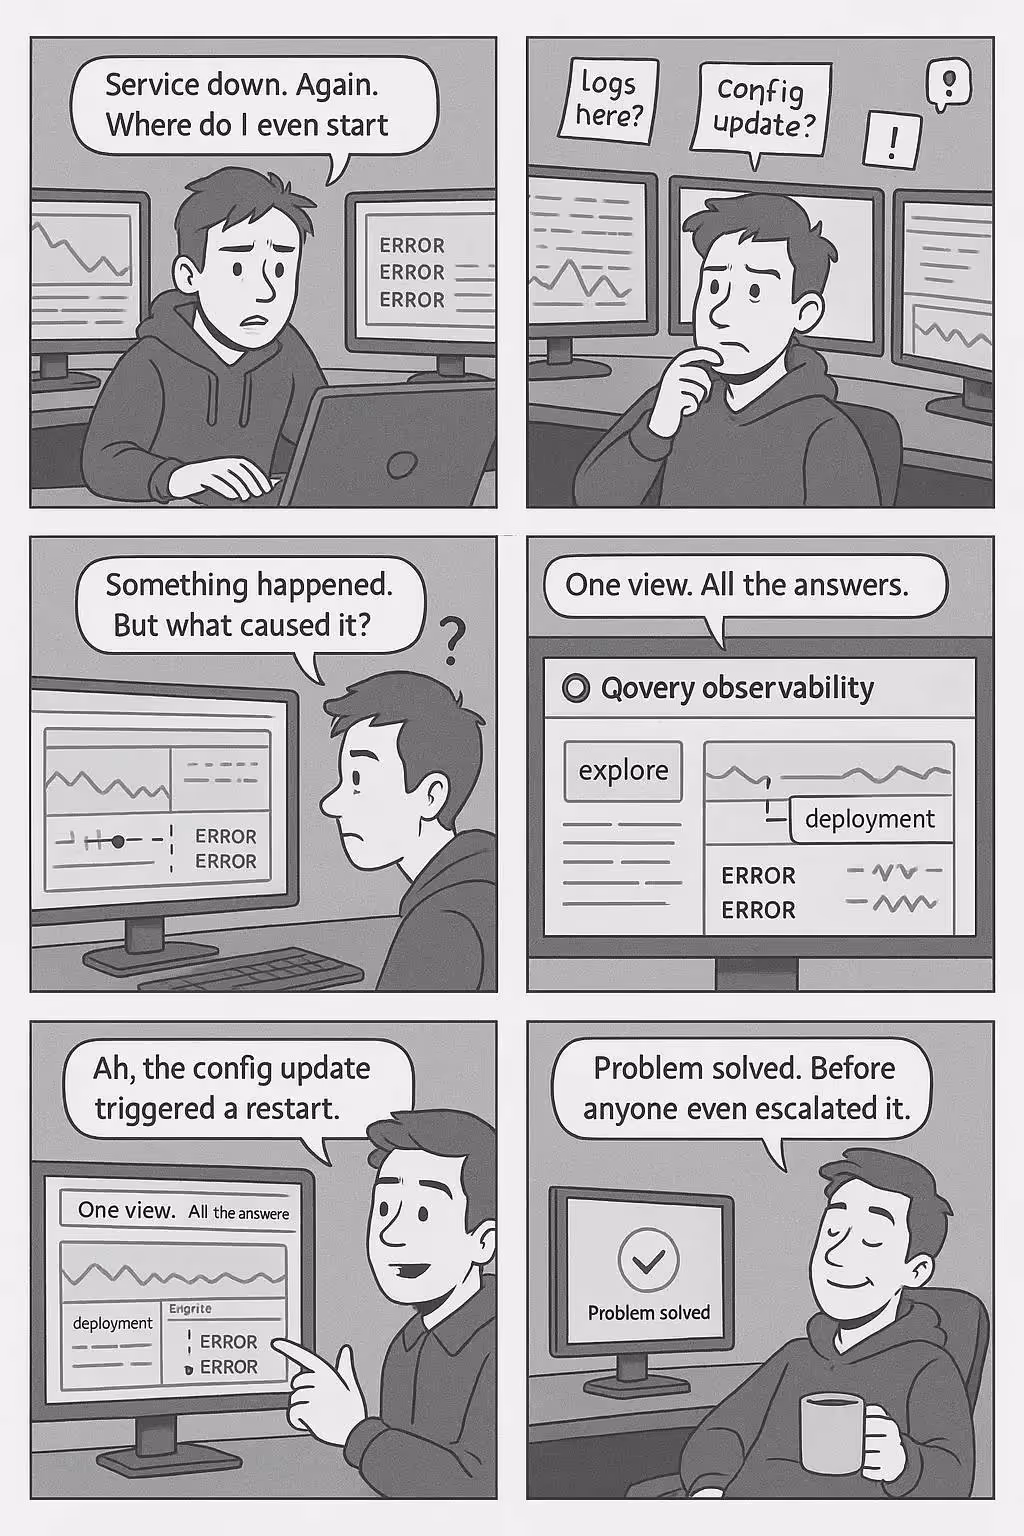
So in the end, no matter the solution you chose, debugging the smallest issue becomes an Odyssey: opening multiple dashboards (application logs, deployment history, nginx metrics, application metrics, etc), waiting for DevOps to share access to metrics, switching between tools to fix your issue and trying to correlate logs and metrics manually. When you think you’ve found the root cause, you’ve probably had your service down for hours, or the root cause is already outdated.

We built Qovery Observability to put an end to that: we have designed our Observability tool for DevOps to remove the mentioned developers' pain points and make sure that every developer can debug any application and infrastructure issue in seconds, not hours.

Qovery Observability has been designed to remove developer's pain-points

This product is strictly related to Qovery’s vision to empower developers with autonomy and confidence. It brings observability directly into their hands and helps shift infrastructure ownership left, closer to those who build and ship the software.

How do we solve this (and why it’s wild 🔥)

At Qovery, we have built this additional layer in our platform to provide you with:

  • 🔎 Unified view: Logs, metrics, and events correlated all in one place. No tab juggling nor context switching. Your application, infrastructure, and Qovery data all in one place.
  • 🧩 No context switch: Everything happens inside the Qovery console. You can deploy your applications, monitor their logs and metrics, and manage your infrastructure.. all in one place, all your tools speak the same language.
  • 🧘‍♂️ Developer autonomy: Built into the Qovery UI. Your devs don’t need to wait for anyone for the setup or to troubleshoot. No DevOps intervention.
  • 📦 Fully managed: Qovery install, maintain, and update the whole stack for you. You don’t even need to know how it works (unless you want to).
  • 🌐 Open source foundation: Powered by OSS tools you trust and widely used in companies (Prometheus, Thanos, Loki), without the pain of integrating and maintaining them yourself.
  • 🔐 Data Ownership: Everything is stored in your cloud account, under your control. And the data retention is configurable.
  • 💰 Transparent Pricing: No surprise bills, no fancy pricing based on data retention or ingestion.

A concrete example

Let's say your checkout API suddenly starts returning 503s:

  1. Alerting phase: Your developer gets alerted instantly, not by a customer but by Qovery Observability, which detects a spike in error rates and provides some information on the ongoing issue: impacted service, diagnosed error, and since when.
  2. High-level investigation phase: Via the link provided in the alert, they open the Qovery dashboard and immediately see a pattern of application instance restarts. A quick glance shows these restarts began right after the last deployment that happened two hours ago (pulled directly from Qovery's deployment history). They can see that the version of their application has changed between the two releases.
  3. Low-level investigation phase: With one click, they access the application logs scoped to the impacted pod right before it restarts.
  4. Root cause identification: The root cause is identified: the new application version is looking for an asset that doesn't exist in production. They quickly roll back the version with Qovery and work later on the fix. All within minutes.

🙌 Join the developers’ revolution

Qovery Observability is about to change the way you ship and run software. It’s simple, powerful, and puts developers in control.

We’re rolling it out soon. Want early access? Want to see a demo?

👉 Contact your CSM!


You're not yet a customer and want to know more about Qovery?

👉 Book a demo

👉 Sign up

Share on :
Twitter icon
linkedin icon
Ready to rethink the way you do DevOps?
Qovery is a DevOps automation platform that enables organizations to deliver faster and focus on creating great products.
Book a demo

Suggested articles

DevOps
 minutes
Top 10 Jenkins Alternatives: The DevOps Guide to Escaping "Plugin Chaos"

Tired of Jenkins maintenance and broken pipelines? Discover the top 10 alternatives to modernize your CI/CD, automate environments, and reduce operational toil.

Mélanie Dallé
Senior Marketing Manager
DevOps
 minutes
10 DigitalOcean Alternatives for Scaling DevOps Teams

Top DigitalOcean alternatives for scaling teams. Compare Qovery (Multi-cloud automation), AWS, GCP, and Vultr to find the best fit for performance and scale.

Mélanie Dallé
Senior Marketing Manager
DevOps
 minutes
Top 5 Vercel Alternatives: Escape Cost, Lock-in, and Frontend Constraints

Stop paying Vercel overages and battling lock-in. Compare Qovery (full-stack automation on your cloud), Render, Netlify, and Fly.io to find the best alternative for DevOps and enterprise scaling.

Mélanie Dallé
Senior Marketing Manager
DevOps
 minutes
Top 8 OrbStack Alternatives: Choosing the Right Tool for DevOps & Production Parity

Top OrbStack alternatives for developers and teams. Compare Qovery, Rancher Desktop, Podman, and Colima to find the best tool for performance, cross-platform stability, and K8s integration.

Mélanie Dallé
Senior Marketing Manager
DevOps
Platform Engineering
9
 minutes
10 Best CI/CD Platforms for DevOps Teams: Automate Pipelines at Scale

Stop managing complex YAML and plugin hell. Compare the top 10 CI/CD platforms for DevOps, from Jenkins to Qovery, and learn how to build high-velocity, automated pipelines on your own cloud.

Morgan Perry
Co-founder
DevOps
 minutes
TPUs vs. GPUs: The DevOps Guide to AI Hardware Selection

Stop guessing on AI hardware. This DevOps guide details when to use TPUs vs. GPUs for optimal performance, cost, and framework compatibility in MLOps.

Mélanie Dallé
Senior Marketing Manager
Cloud
Business
10
 minutes
The DevOps Guide to Docker Monitoring: Tools, Best Practices, and Unified Observability

Stop tool sprawl. Compare top Docker monitoring tools (Prometheus, Datadog, Qovery) and learn how unified observability simplifies K8s debugging and speeds up feature delivery.

Romaric Philogène
CEO & Co-founder
Cloud
Heroku
Internal Developer Platform
Platform Engineering
9
 minutes
The Top 8 Tools to Build a Zero-Toil PaaS on Your Cloud

Stop managing K8s complexity. Discover the top 8 platform tools (Qovery, Rancher, Dokku) that let you build a customizable, zero-maintenance PaaS on your cloud.

Morgan Perry
Co-founder

It’s time to rethink
the way you do DevOps

Turn DevOps into your strategic advantage with Qovery, automating the heavy lifting while you stay in control.