Observability in DevOps: what is it, observe vs. monitoring, benefits
Observability in DevOps: Diagnose system failures faster. Learn how true observability differs from traditional monitoring. End context-switching, reduce MTTR, and resolve unforeseen issues quickly.
Observability vs. Monitoring: Observability is the capacity to diagnose unforeseen issues by examining a system's external data, allowing engineers to figure out why something broke. Monitoring, conversely, only tells you what broke based on predefined alerts for anticipated problems.
The Three Pillars: Effective observability relies on the seamless correlation of three types of telemetry data: Logs, Metrics, and Traces.
The Fragmentation Problem: In distributed systems, data volume is massive, and telemetry lives in separate, fragmented tools. This forces engineers into constant context switching, manually correlating data across platforms and significantly increasing the Mean Time to Resolution (MTTR).
When a production request fails, how much time is wasted manually bouncing between the logging platform, the metrics dashboard, and the APM tool just to find the root cause? For teams running complex distributed systems, the tools exist, but correlating data across them consumes more time than resolving the actual problem.
Observability in DevOps addresses this painful gap. Rather than simply reacting to predefined alerts, observability provides the crucial context and unified view needed to diagnose unforeseen issues quickly and without needing new code.
What is Observability in DevOps?
Observability measures how well you can understand a system's internal state by examining the data it produces externally. In DevOps contexts, this means having sufficient data and tooling to diagnose unforeseen issues without deploying new code or adding instrumentation after the fact.
In software systems, observability answers a simple question: when something breaks unexpectedly, can you figure out why?
Modern distributed systems present unique challenges for understanding system behavior. A single user request might traverse dozens of services, each generating logs, emitting metrics, and contributing to latency. Without observability, engineers need to reconstruct this path manually by gathering data across various systems.
Effective observability in DevOps relies on three pillars, each providing different insights into system behavior.
Logs capture discrete events with timestamps and contextual messages. They record what happened at specific moments: a user logged in, a database query executed, an error occurred. Logs provide the detail needed to understand specific failures, but their volume in distributed systems makes manual analysis impractical without proper tooling.
Metrics represent numerical measurements collected over time. Request rates, error percentages, response latencies, CPU utilization, and memory consumption all fall into this category. Metrics answer quantitative questions: how many requests per second, what percentage failed, how long did operations take? They are efficient for dashboards and alerting but less useful for diagnosing individual failures.
Traces follow a single request as it propagates through multiple services. A trace captures the full journey: which services handled the request, how long each spent processing it, and where delays occurred. Traces reveal the relationships between services and help identify bottlenecks in complex request flows.
Challenges in Achieving Observability
The shift to distributed architectures like microservices and containers has made observability both more necessary and more difficult to achieve. Several obstacles prevent teams from reaching effective observability.
1. Data Volume and Context Switching
Distributed systems generate substantial telemetry data. A moderately complex microservices application might produce gigabytes of logs daily, millions of metric data points, and traces for every request. This data lives in separate systems: logs in Elasticsearch or CloudWatch, metrics in Prometheus or Datadog, traces in Jaeger or Honeycomb.
Engineers investigating incidents switch between tools constantly. They search logs in one interface, check metrics in another, and examine traces in a third. Each context switch costs time and breaks concentration. Correlating data manually requires matching timestamps, request IDs, and service names across systems with different query languages and interfaces.
This fragmentation extends troubleshooting time significantly. Teams often spend more time navigating tools than analyzing the data itself.
2. The Observability Gap
Engineering teams face a difficult choice when implementing observability infrastructure.
Expensive SaaS platforms offer integrated experiences with minimal maintenance. They handle data ingestion, storage, querying, and visualization. However, costs scale with data volume, and pricing can become substantial for high-traffic applications. These platforms also require exporting telemetry data outside organizational infrastructure, raising concerns for teams with strict data residency or security requirements.
Complex DIY stacks using open-source tools provide flexibility and data control. Prometheus, Grafana, Elasticsearch, and Jaeger form a capable observability platform. But operating these systems demands ongoing engineering effort. Teams must handle upgrades, scaling, high availability, and integration work. What starts as a simple deployment grows into a significant operational burden that requires constant maintenance.
Neither option satisfies teams seeking integrated observability without excessive cost or maintenance overhead.
3. Focus on Monitoring vs. Observing
Many teams confuse monitoring with observability, believing they have solved the problem when they haven’t yet.
Monitoring tells you what is broken based on predefined alerts. You configure thresholds for known failure modes: CPU exceeds 80%, error rate crosses 5%, disk space drops below 10GB. When conditions breach, alerts fire. Monitoring works well for anticipated problems with clear signatures.
Observability allows you to discover why something broke, even for issues you never expected. When a failure occurs, observability provides the raw data and correlation capabilities to investigate without having predicted the failure mode in advance.
This distinction matters as systems grow more complex. Microservices architectures multiply the potential failure modes beyond what any team can anticipate. Teams relying solely on monitoring spend significant time adding new alerts after each incident, always reacting rather than understanding.
Benefits of Effective Observability
Implementing true observability yields measurable operational and business advantages across several dimensions.
1. Faster Mean Time to Resolution
The ability to quickly correlate logs, metrics, and traces reduces the time spent diagnosing production incidents. When engineers access all telemetry data from a single interface with automatic correlation, diagnosis and resolution accelerate.
Faster resolution translates directly to reduced downtime. For customer-facing applications, this means fewer users affected by outages. For internal systems, less productivity is lost to broken tools. The cumulative impact on reliability metrics compounds over time.
2. Reduced Development Toil
Without effective observability, debugging becomes a time sink that pulls engineers away from product development work. Developers spend hours in reactive debugging mode, building knowledge about where to look for specific problems and how to correlate data manually.
Better observability reduces this burden significantly. Engineers spend less time on repetitive investigation work and more time on feature development and innovation. On-call rotations also become a smaller burden on engineering organizations when incidents resolve quickly.
3. Proactive System Health
Teams with effective observability spot and resolve issues before they escalate into major outages. Patterns become visible: gradual memory leaks, slowly degrading response times, resource saturation approaching limits, etc.
Addressing these issues proactively avoids the customer impact and operational stress of production incidents. This shift from reactive firefighting to proactive maintenance represents a maturity improvement for engineering organizations.
4. Unified Context
When all teams access the same observability data through a single interface, collaboration improves. Developers, operations engineers, and security teams share a common view of system behavior.
This shared context creates a single source of truth that improves accountability. When everyone can see what happened, post-incident reviews focus on systemic improvements rather than reconstructing timelines from fragmented data sources.
Agents ship fast. Guardrails keep them safe.
Qovery ensures every agent action is scoped, audited, and policy-checked. Start deploying in under 10 minutes.
Qovery Observe: Integrated Observability Without the Overhead
Qovery Observe addresses the observability gap by providing a built-in, unified, and zero-maintenance solution that lives directly where your deployments are.
Unified Single-Console Experience
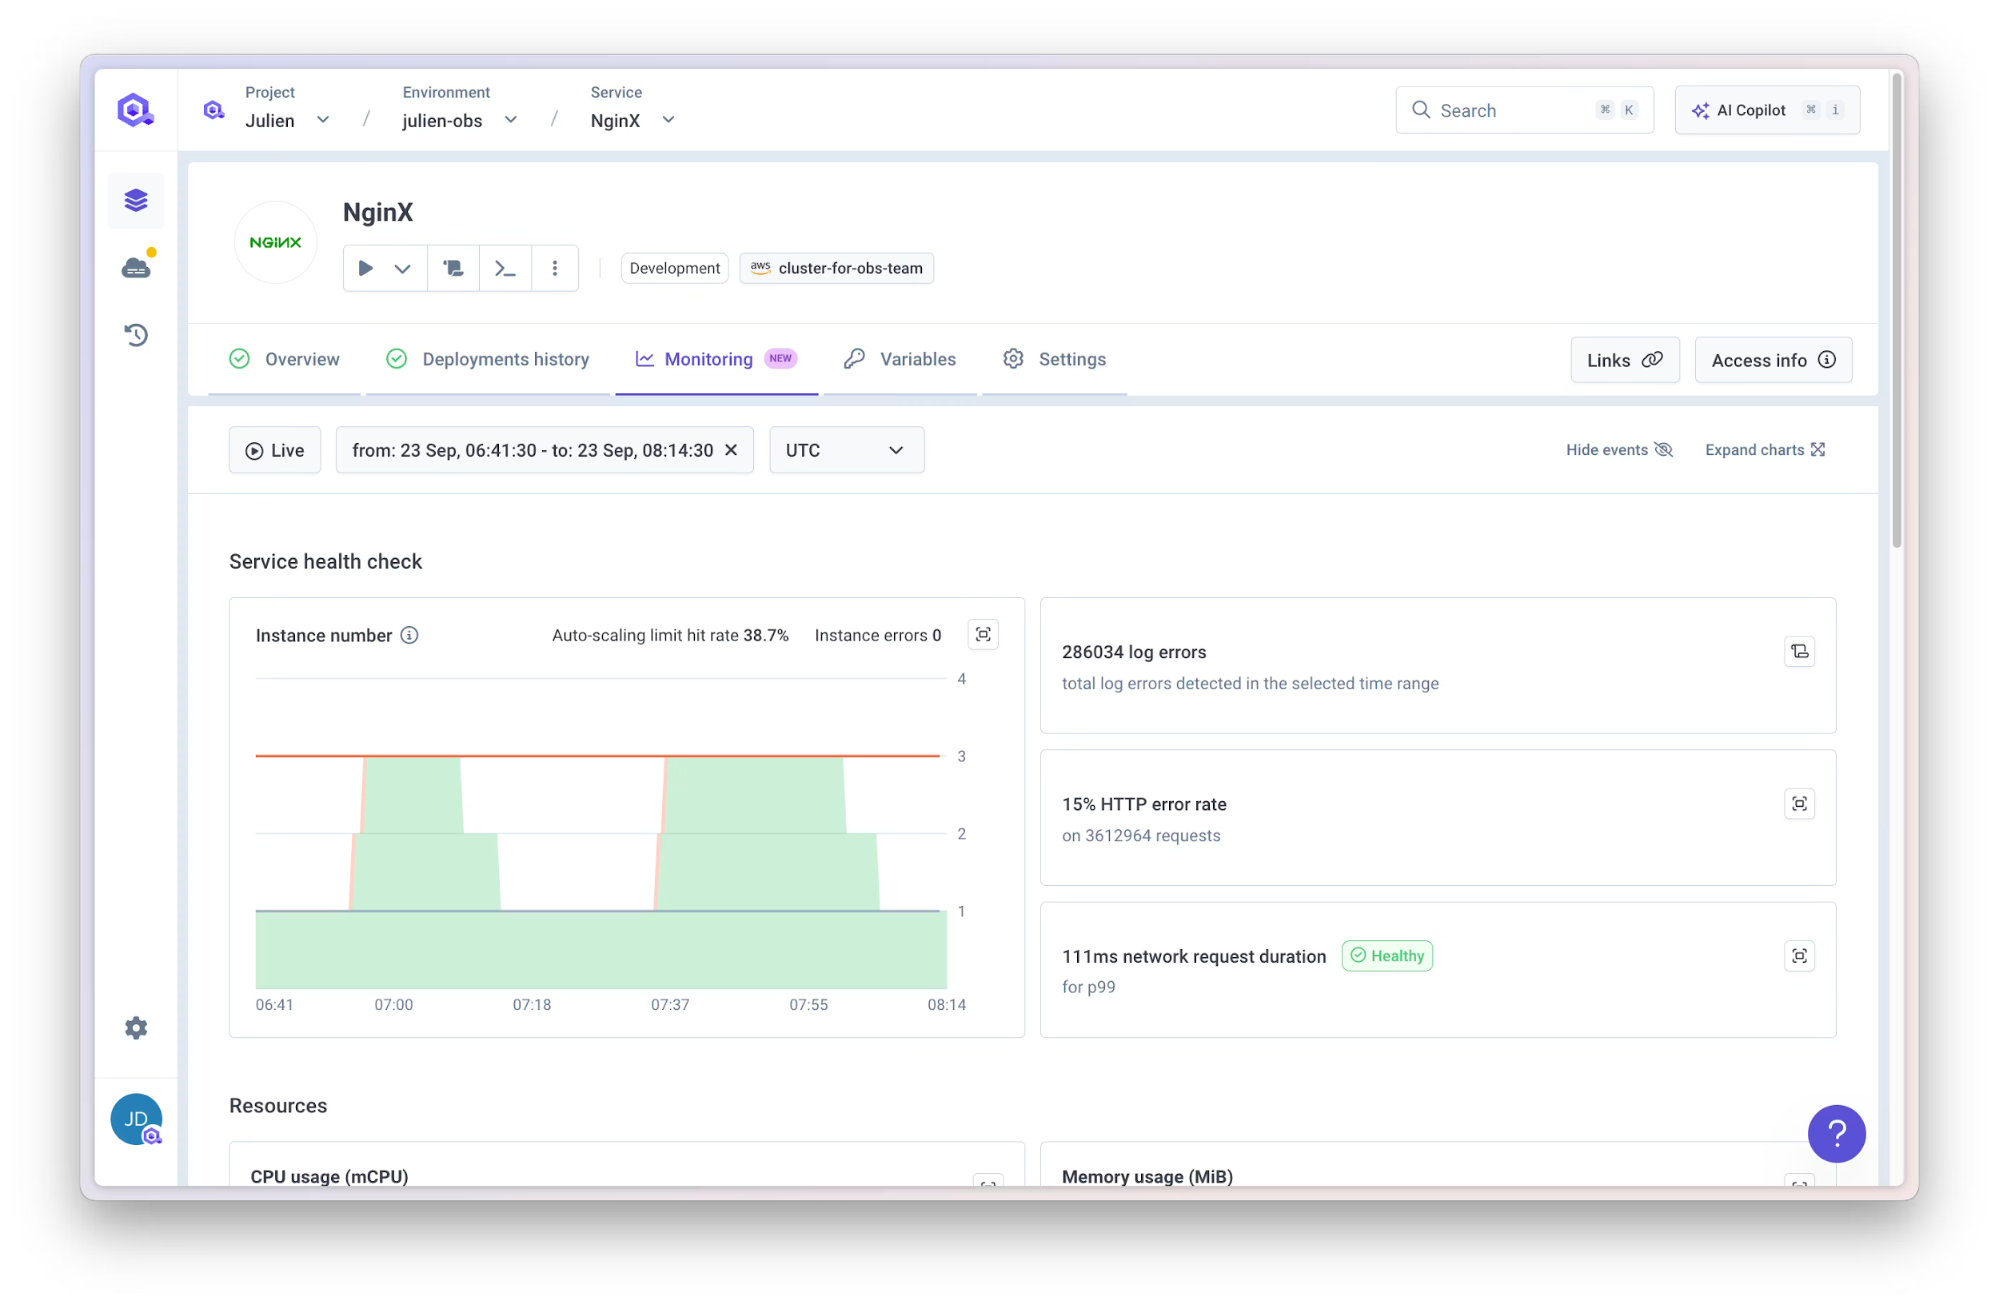
Qovery integrates logs, metrics, and events directly into the deployment platform. Engineers search and filter logs by level, time range, or service without switching to external tools. This means troubleshooting happens in the same interface where teams manage deployments and application configuration.
The integration removes the context-switching overhead that slows investigation. Everything needed to diagnose issues lives in one console, organized around the applications and environments teams already work with daily.
Zero Maintenance and Integrated
The platform is built-in and integrated with your applications natively. Operating teams don't need to manage Elasticsearch clusters or Prometheus storage as Qovery handles the underlying infrastructure automatically.
This approach removes the burden of setting up, maintaining, and scaling complex DIY monitoring stacks. Engineering time goes toward building products rather than operating observability infrastructure.
Contextual Troubleshooting
Qovery lets you move from detection to diagnosis seamlessly. The Observe add-on automatically applies log filters when you click on an error spike in the metrics dashboard, setting the time range and error level to provide instant correlation and root cause context.
This automatic correlation eliminates manual timestamp matching or cross-referencing applications across tools. When problems appear in metrics, the relevant logs are a click away with filters already applied.
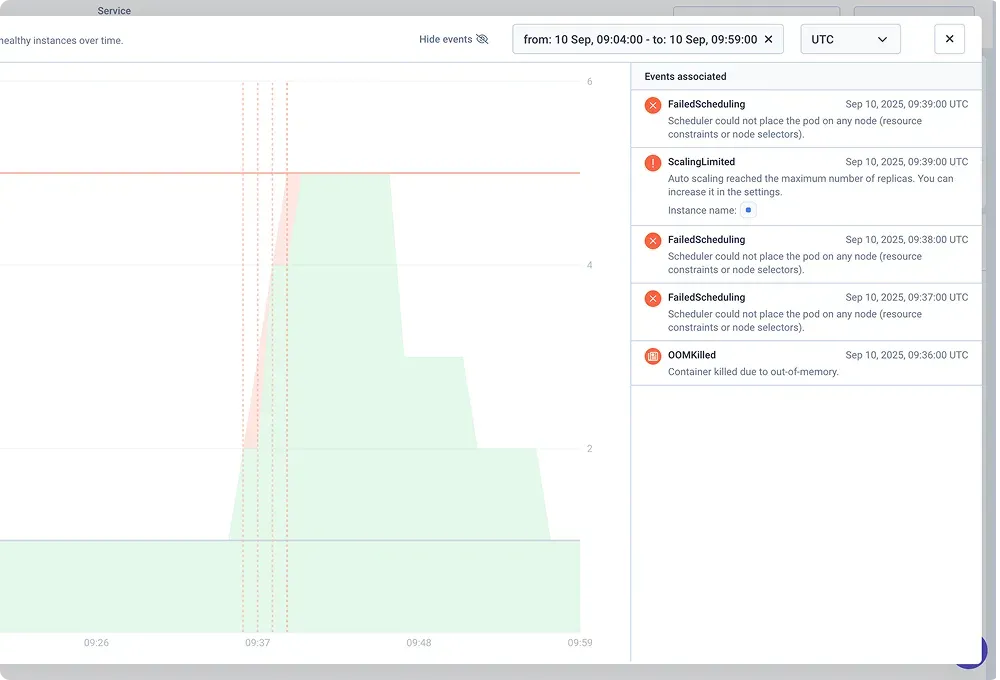
Tiered Visibility
Qovery offers flexible log retention up to 12 weeks with the Observe add-on. The platform tracks events from both Qovery and Kubernetes, giving teams a correlated view of deployment activity and scaling behavior alongside application telemetry.
This unified timeline reveals connections between infrastructure changes and application problems. When issues coincide with deployments or autoscaling events, the relationship is immediately visible without cross-referencing separate systems.
Conclusion
Observability in DevOps represents a shift from knowing what broke to understanding why. While monitoring alerts teams to predefined conditions, observability provides the context to diagnose unforeseen issues and prevent recurrence.
Achieving effective observability requires more than installing tools. It demands integration between logs, metrics, and traces that enables rapid correlation during incidents. Many teams struggle with fragmented tooling that provides data without the unified view needed for fast diagnosis.
Qovery Observe offers an integrated DevOps observability tool that eliminates the maintenance burden of self-managed stacks while keeping data on your infrastructure. Teams gain the diagnostic capabilities they require without the operational overhead or data export concerns of external platforms.
Melanie leads content at Qovery. She covers platform engineering trends, Kubernetes operations, FinOps, and the tools that help engineering teams ship faster.
Next step
Agents ship fast. Guardrails keep them safe.
Qovery ensures every agent action is scoped, audited, and policy-checked. Start deploying in under 10 minutes.