Making Qovery builds as fast as GitHub Actions, and then faster
Our customers compared Qovery builds with GitHub Actions, and Qovery was slower. Here is what we measured on a public benchmark, what we fixed in October, why every build waited 30 seconds for nothing, the new Build Optimizer, and our plan to make Qovery the fastest way to go from a commit to running code.
Qovery has built container images since day one. For years, though, we spent our engineering time on deployment and infrastructure, not on build speed.
Our customers compared us with GitHub Actions, and we were slower. In a public benchmark in September, Qovery builds took 1.4x to 3.6x longer than on GitHub's standard runner.
We shipped four fixes in October. Builders went from 8 GB to 16 GB of RAM, builder nodes moved to local NVMe disks, images and the build cache now use zstd compression, and Qovery stopped cloning the repository again when the image already exists. The median customer build went from about 4.5 minutes in September to about 2.5 minutes over the last 30 days.
Every build waited about 26 seconds for nothing. BuildKit waited for a health check that only ran every 30 seconds. The fix is part of buildx v0.39, which Docker released on 11 November, and Qovery runs it since 12 November.
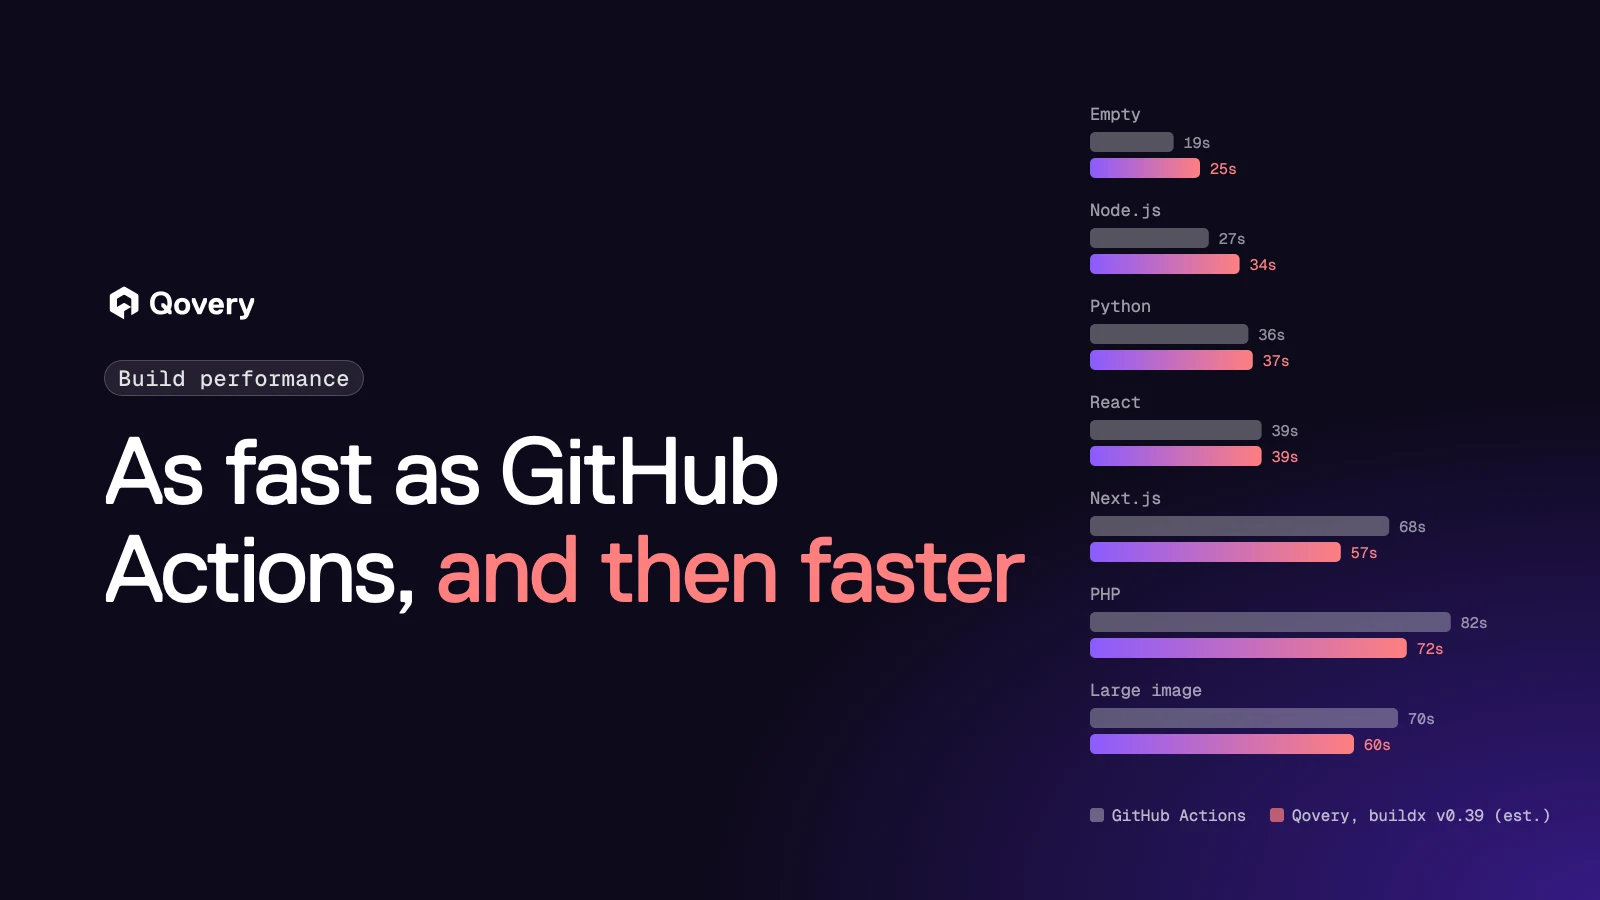
With buildx v0.39, Qovery is as fast as GitHub Actions on typical apps and faster on heavier builds. Next.js, PHP and large image builds take 0.84x to 0.88x of GitHub's time, based on our measurements.
Qovery now tells you why a build is slow. New deployment logs show the time of each step, and the Build Optimizer reads your Dockerfile, build logs and cache history and gives you a corrected Dockerfile. Both are live in the Console since 12 November, open to a first group of customers.
This is only the first step. Next, we work on building an image once and deploying it many times, faster CPUs, a build cache that stays on the builder, and taking the cache export off the critical path.
Qovery has built container images since the first version of the product. You connect a Git repository and push a commit. Qovery builds the image, pushes it to a registry and deploys it on Kubernetes in your own cloud account. Build has always been part of the product.
For a long time, it was also the part we worked on the least. Our roadmap went to the deployment engine, cluster management, environments, security and, more recently, AI agents. Builds worked, so we did not change them much.
Our customers saw it differently. Most of them already use GitHub Actions, so they compare our builds with GitHub Actions. Some told us our builds felt slow. A few moved their image builds to GitHub Actions and used Qovery only to deploy the result. These customers still paid for Qovery, but they did not use our builds. That told us we had a real problem.
So in September we gave the team a clear goal: build faster than GitHub Actions. The first step was to measure how far behind we were.
How we measured Qovery against GitHub Actions
Antoine Promerova, from our platform team, wrote a set of test projects that look like the apps our customers deploy. He published them in a public repository: github.com/Astach/qovery-ci-benchmark. Anyone can run them again.
Fixture
What it is
Empty build
A minimal image with almost no build work, to measure the fixed overhead
Node.js backend
Express and TypeScript API
Python backend
FastAPI with several native wheels
React front end
Vite, React and TypeScript, served by nginx
Server-rendered front end
Next.js with standalone output
PHP backend
Composer and Vite assets, PHP-FPM behind nginx
Large image
A final layer of about 2.5 GB, to test registry speed
All dependency versions are fixed, so a test run in a few months installs exactly the same packages. On GitHub, every build runs on the standard ubuntu-latest runner with Docker Buildx. On both platforms, we start the timer at checkout and stop it when the image is in the registry. This is the time a developer, or an agent, waits.
In September, Qovery was 1.4x to 3.6x slower than GitHub Actions on every test project. The gap was largest on the smallest builds. So most of the gap came from fixed overhead, not from the build work itself.
What we found and fixed in October
The benchmark and the new build metrics Antoine added to our engine showed four problems.
1. We rebuilt images we already had. Qovery already skips the build when the same commit, Dockerfile and build arguments produced an image before. But the engine cloned the whole repository on every deployment before it checked. On monorepos and on setups with many environments, this wasted many minutes. Now the engine checks for the image first and skips the clone.
2. Builders did not have enough memory. Our builders had 8 GB of RAM. Memory was the main limit on Node.js, Next.js and PHP builds, because installing dependencies and bundling code use a lot of it. We doubled the builders to 16 GB.
3. Disks were slow. Builds read and write many small files. Builder nodes now use local NVMe disks instead of network disks.
4. Images and cache moved more data than needed. Every build pulls its cache from the registry and pushes the new image back. Qovery now compresses image layers and the build cache with zstd instead of gzip. zstd compresses and decompresses faster, so less time goes to registry transfers.
These changes are live, and every build on Qovery gets them with no change on your side. The median customer build went from about 4.5 minutes in September to about 2.5 minutes over the last 30 days.
Why every build waited 30 seconds
After these fixes, one problem stayed. Every Qovery build waited about 30 seconds before BuildKit could start, whatever the size of the project. On an empty build, this was most of the total time.
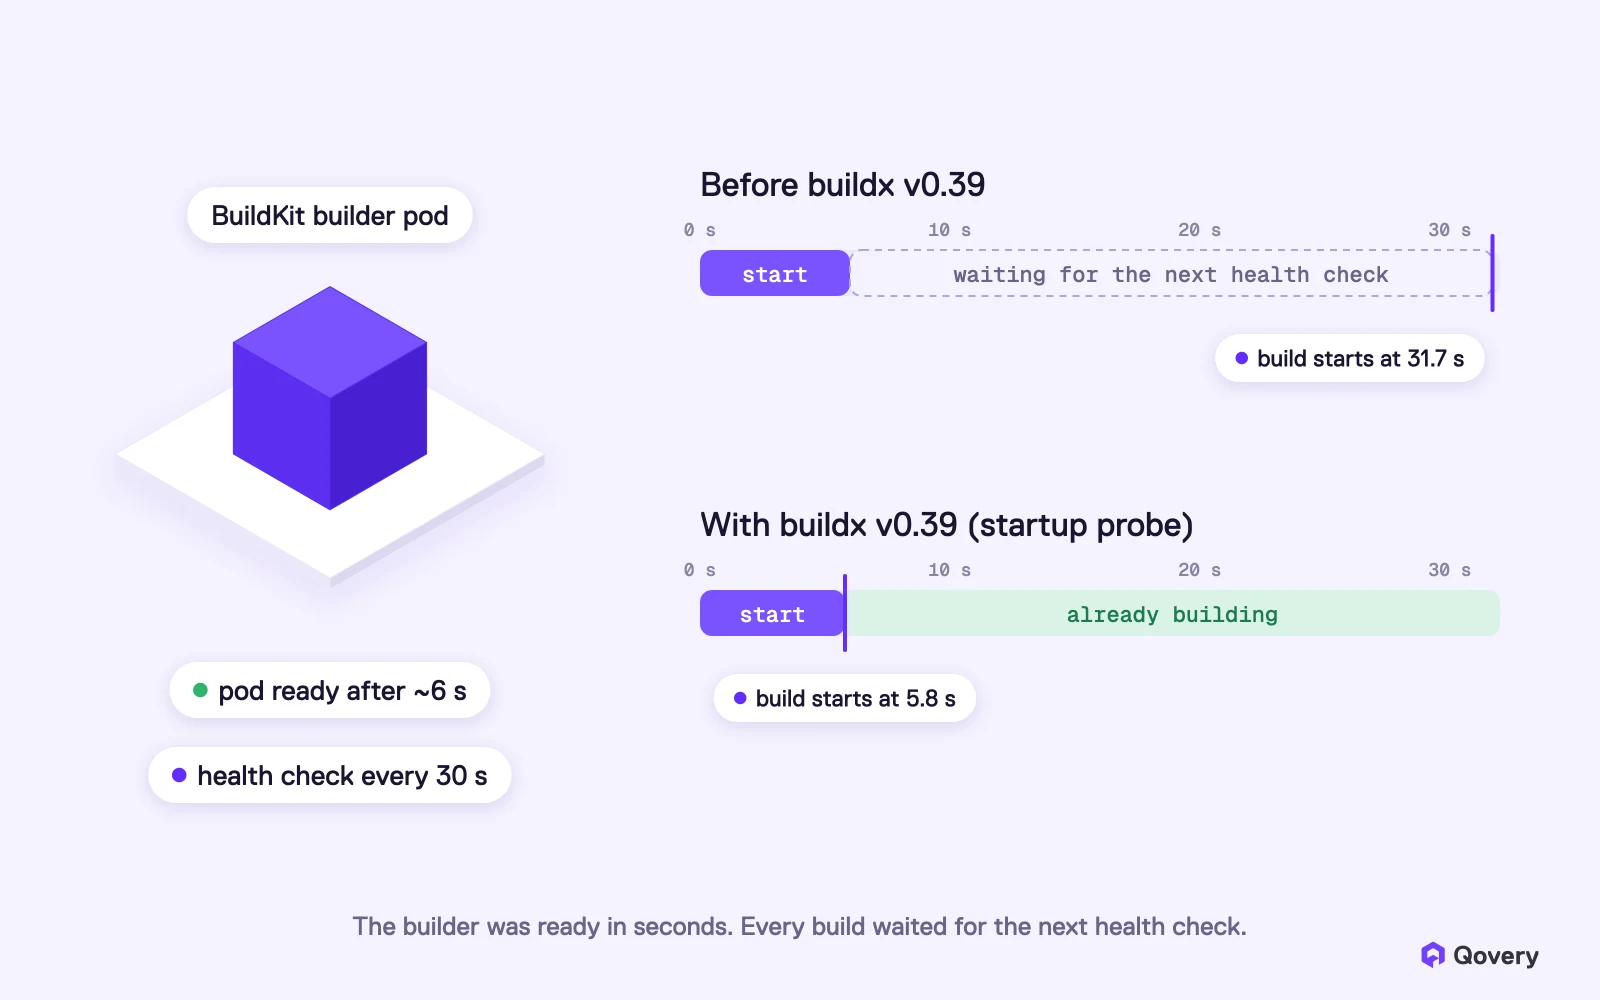
We thought the cause was the time to start a new BuildKit pod. We were about to build a pool of builders that are always running, to hide that delay. First, Antoine looked closer, and he found a different cause. The builder pod was ready after a few seconds, but Kubernetes did not know it yet. The readiness check started after a delay and then ran only every 30 seconds. docker buildx create --bootstrap waits for this check, so every build waited for almost 30 seconds with nothing to do.
A fix already existed in Docker Buildx. A Buildx contributor replaced the delay with a Kubernetes startup probe. Now the pod reports that it is ready right after buildkitd starts (docker/buildx#4124). Docker merged the fix on 9 October and released it in buildx v0.39 on 11 November. Before the release, we tested a patched version in our engine:
Builder setup
Time until the builder is ready
Current buildx
31.7 s (30.9 to 31.9)
With the startup probe fix
5.8 s (5.8 to 6.0)
Before buildx v0.39, the build waited for the next health check. Now it starts as soon as the builder is ready.
This saves about 26 seconds on every build, and we do not need a pool of always-running builders. Qovery runs buildx v0.39 since 12 November. On the preview environment of this very article, the builder took 35 seconds to start in the morning, before the update, and 5 seconds in the afternoon, after it.
Qovery and GitHub Actions with buildx v0.39
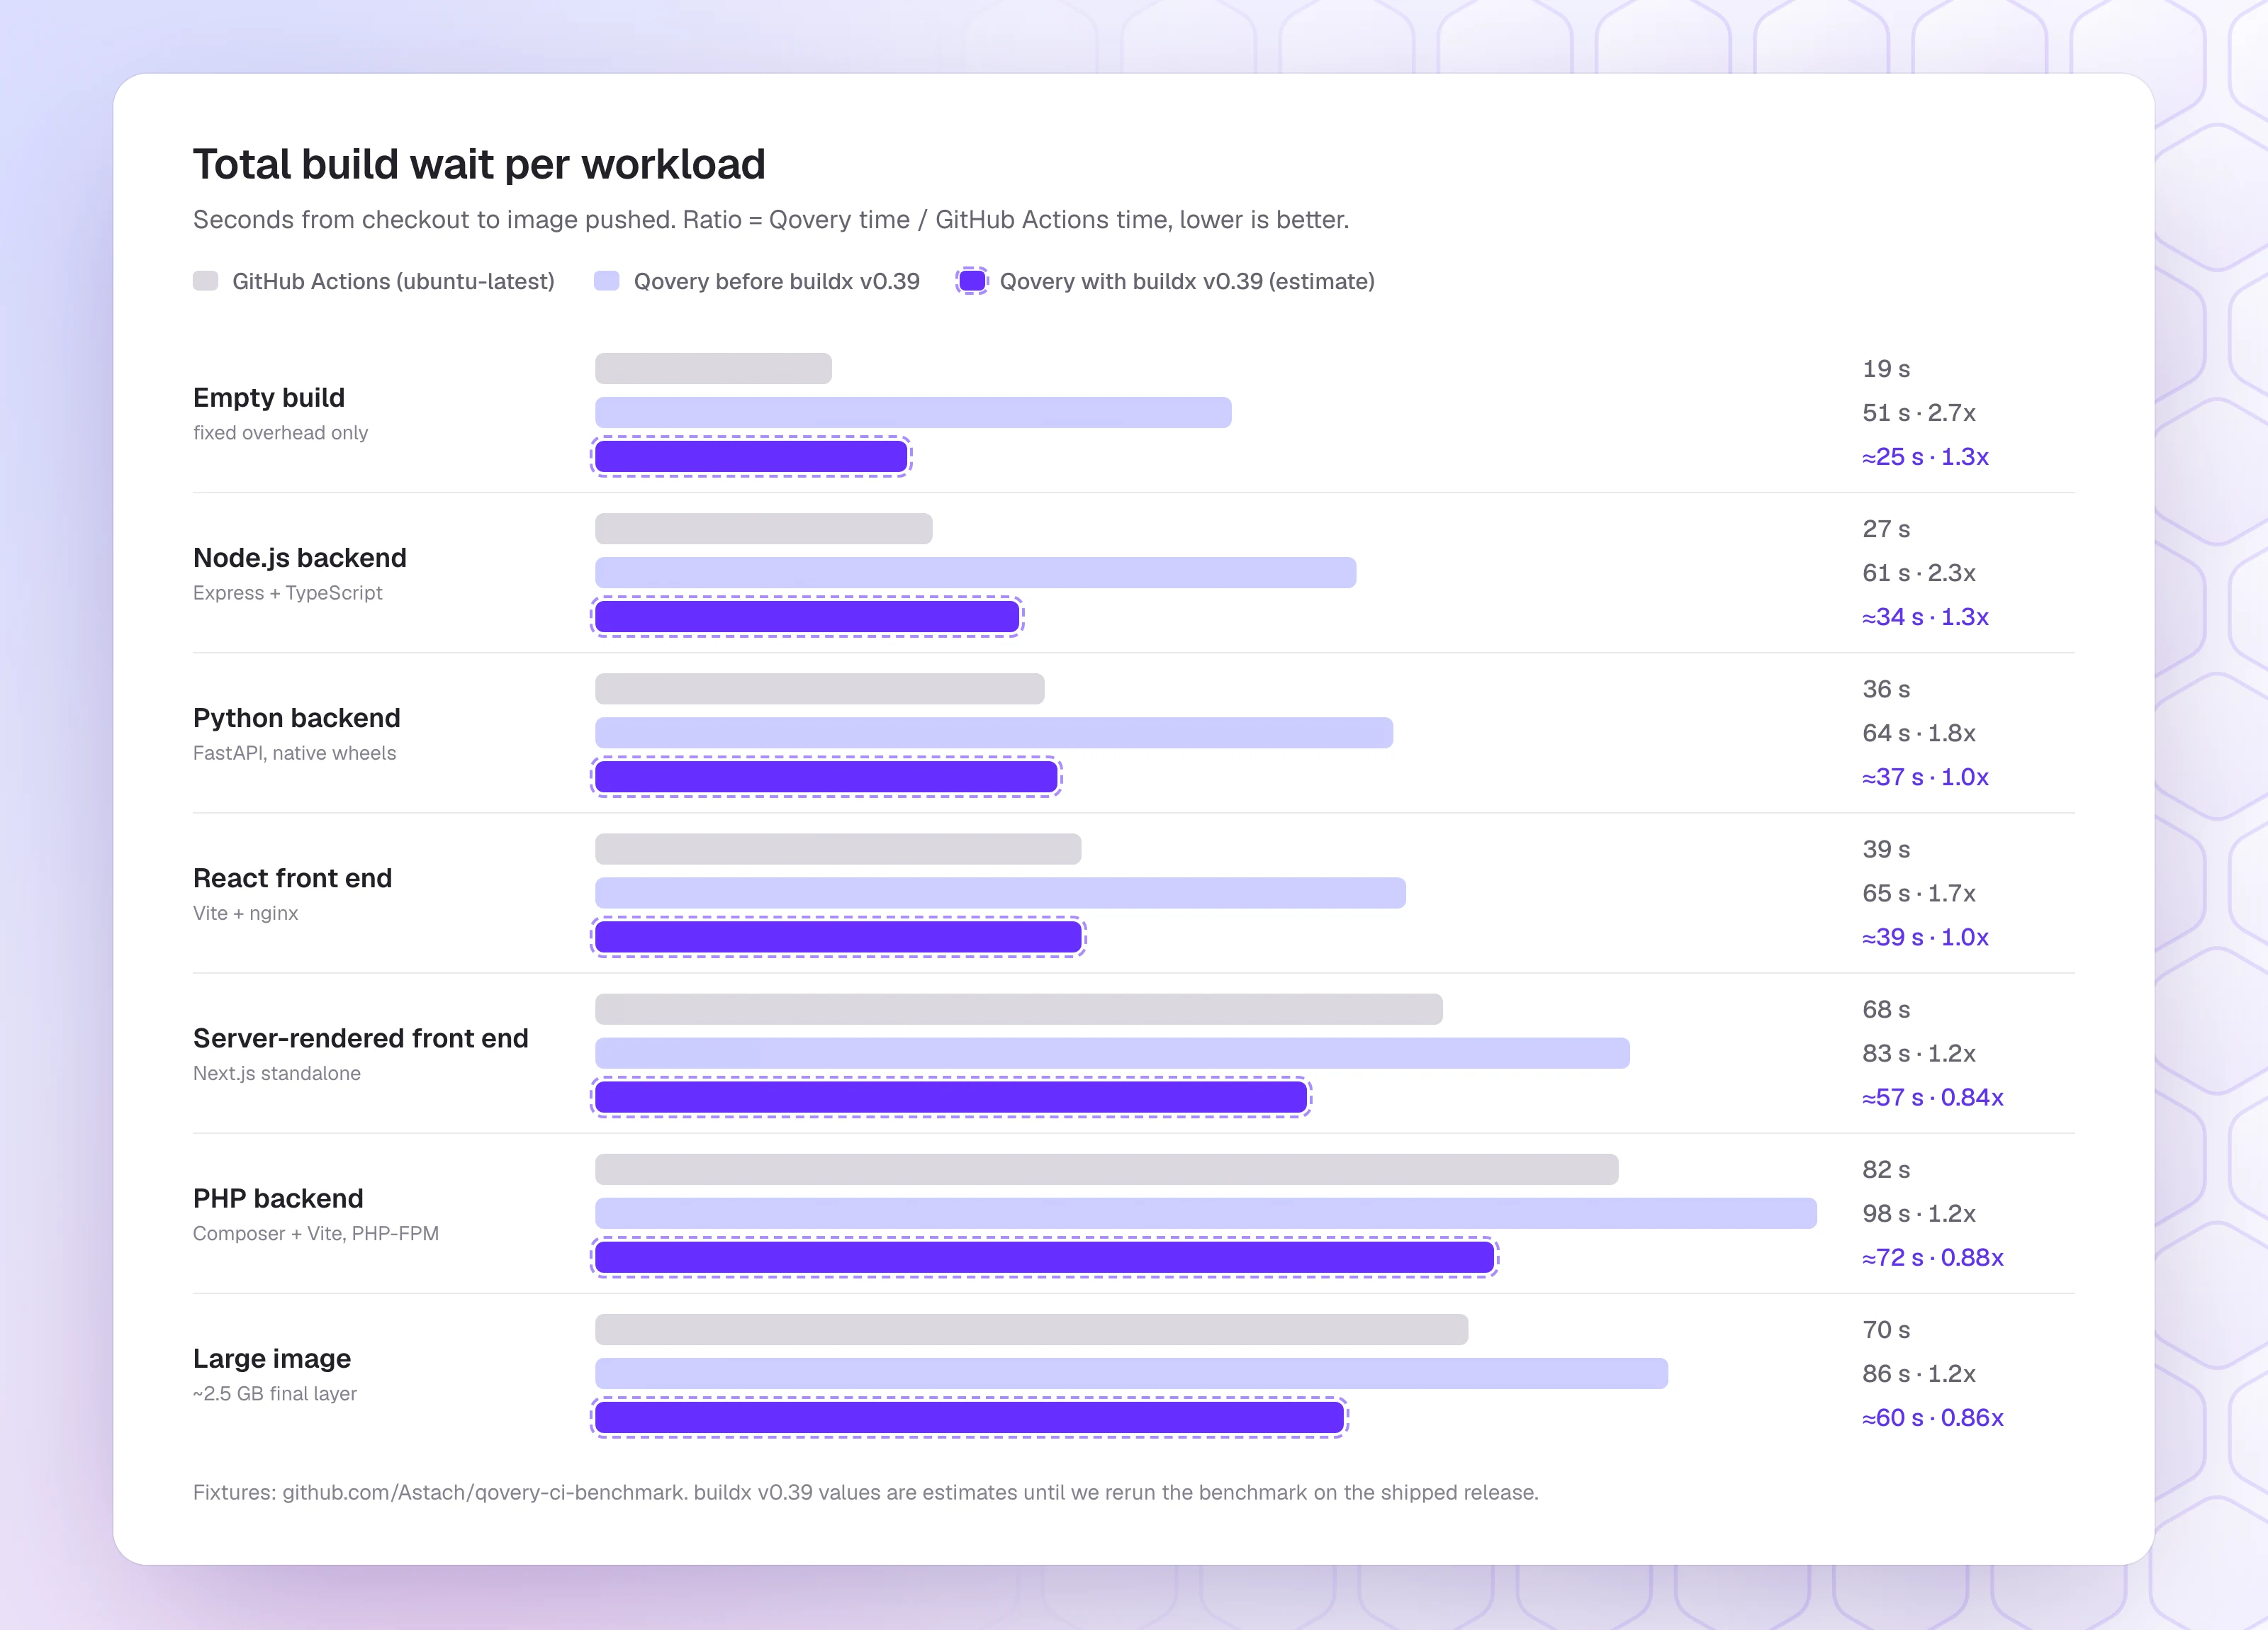
Here are the results for each test project: GitHub Actions, Qovery before buildx v0.39, and Qovery with buildx v0.39. The ratio is Qovery's time divided by GitHub's time. Lower is better, and a ratio under 1.0x means Qovery is faster.
Total wait per workload, from checkout to image pushed. The dashed bars are estimates, computed from measured Qovery runs minus the BuildKit readiness wait that buildx v0.39 removes.
Workload
GitHub Actions
Qovery before v0.39
Ratio before
Qovery with buildx v0.39
Ratio with v0.39
Empty build
19 s
51 s
2.7x
about 25 s
1.3x
Node.js backend
27 s
61 s
2.3x
about 34 s
1.3x
Python backend
36 s
64 s
1.8x
about 37 s
1.0x
React front end
39 s
65 s
1.7x
about 39 s
1.0x
Server-rendered front end
68 s
83 s
1.2x
about 57 s
0.84x
PHP backend
82 s
98 s
1.2x
about 72 s
0.88x
Large image
70 s
86 s
1.2x
about 60 s
0.86x
Three notes on these numbers:
The v0.39 column is still an estimate. We measured the "before" numbers. For the v0.39 numbers, we took those results and removed the wait that we measured with the fixed builder. Our first readings since the release on 12 November match these estimates. We are running the full benchmark again, and we will update this table with the measured results.
Qovery is now faster on heavier builds. Without the fixed wait, the bigger builders and NVMe disks make a difference. The Next.js, PHP and large image builds finish 12% to 16% faster than on GitHub's runner. Heavy images already win today on a cold build with no cache: 149 seconds on Qovery against 181 seconds on GitHub Actions.
Very small builds are still slower. On the empty build and the small Node.js API, Qovery is still at 1.3x. A few seconds of fixed overhead count a lot in a 20-second build. This is the next thing we will fix.
Before buildx v0.39, a typical Python or React service took 1.7x to 1.8x longer to build on Qovery than on GitHub Actions. With buildx v0.39, both take the same time.
Build and deploy from one place, on your own cloud.
Our customers compared Qovery builds with GitHub Actions, and Qovery was slower. Here is what we measured on a public benchmark, what we fixed in October, why every build waited 30 seconds for nothing, the new Build Optimizer, and our plan to make Qovery the fastest way to go from a commit to running code.
A faster platform is only half of the work. Often, the Dockerfile itself makes a build slow: dependencies installed after the source code is copied, a missing .dockerignore, or build arguments that change between environments and make the cache useless. So we built two features to find these problems.
Deployment logs with step timings. Logs are now split by phase and by step, with the time each step took. You see at a glance where a deployment spends its time, and the step that failed opens on its own.
The Build Optimizer. On your latest build, one click starts an AI analysis of your Dockerfile, your build logs and your cache history. It tells you why the build was slow, how much time you could save, and how sure it is:
High: the logs or earlier builds show both the cause and the seconds it costs.
Medium: one of the two is shown, and the other is estimated.
Low: only the Dockerfile suggests it, with no proof in the build.
It returns a corrected Dockerfile and a prompt you can paste into your coding agent. It never changes anything on its own: you review the change and apply it. On one build we analyzed, the estimated saving was 40% to 50% of the build time.
Both features are live in the Console since 12 November. For now they are open to a first group of customers, so we can collect feedback before we open them to everyone. You find them in the deployment history of any service. If you want to try them, ask us in your Slack channel or through support. The Build Optimizer needs AI features enabled for your organization, and the Build Optimizer documentation explains how it works.
Why build speed matters more today
When people started every build, a 30-second difference was not a big problem. You pushed your code, had a coffee, and came back.
Our customers do not work like this anymore. AI coding agents open pull requests all day, and each pull request can get its own preview environment. Agents build, deploy, test and try again, many times. Some of our customers run many builds at the same time when agents push a lot of work at once. Here, build time decides how fast the whole cycle goes. Every second of fixed overhead is repeated in every build, and the platform must handle many builds starting at the same moment.
So this work does not stop here. We want Qovery to have the fastest build system on the market. We will measure it with one number: the time from a commit to code running in your environment.
Bigger machines alone will not get us there. Dedicated build services can make the build step fast, but the image still has to reach a registry, then a deployment tool, then your cluster. Each handoff adds waiting and one more system to configure. Qovery runs the whole chain: build, registry, deployment and the Kubernetes cluster in your own cloud account. So we can remove waste between the steps too, not only inside the build: skip a build when the image already exists, and soon start the deployment before the cache export ends and reuse one image across all your environments.
What comes next
With buildx v0.39, Qovery is as fast as GitHub Actions on typical apps. To be clearly faster, we first looked at where the time goes in our slowest builds, the ones over 400 seconds. This breakdown comes from build logs between 30 September and 6 October, before the NVMe and zstd changes:
Step
Share of build time
Installing dependencies
22%
Compiling
20%
Other RUN steps
17%
COPY
12%
Image push
12%
Cache export
9.5%
Cache import
4.7%
Other
2.8%
Builder start and Git clone are separate steps, so they are not in this table. Here is what we are working on, starting with the biggest effect.
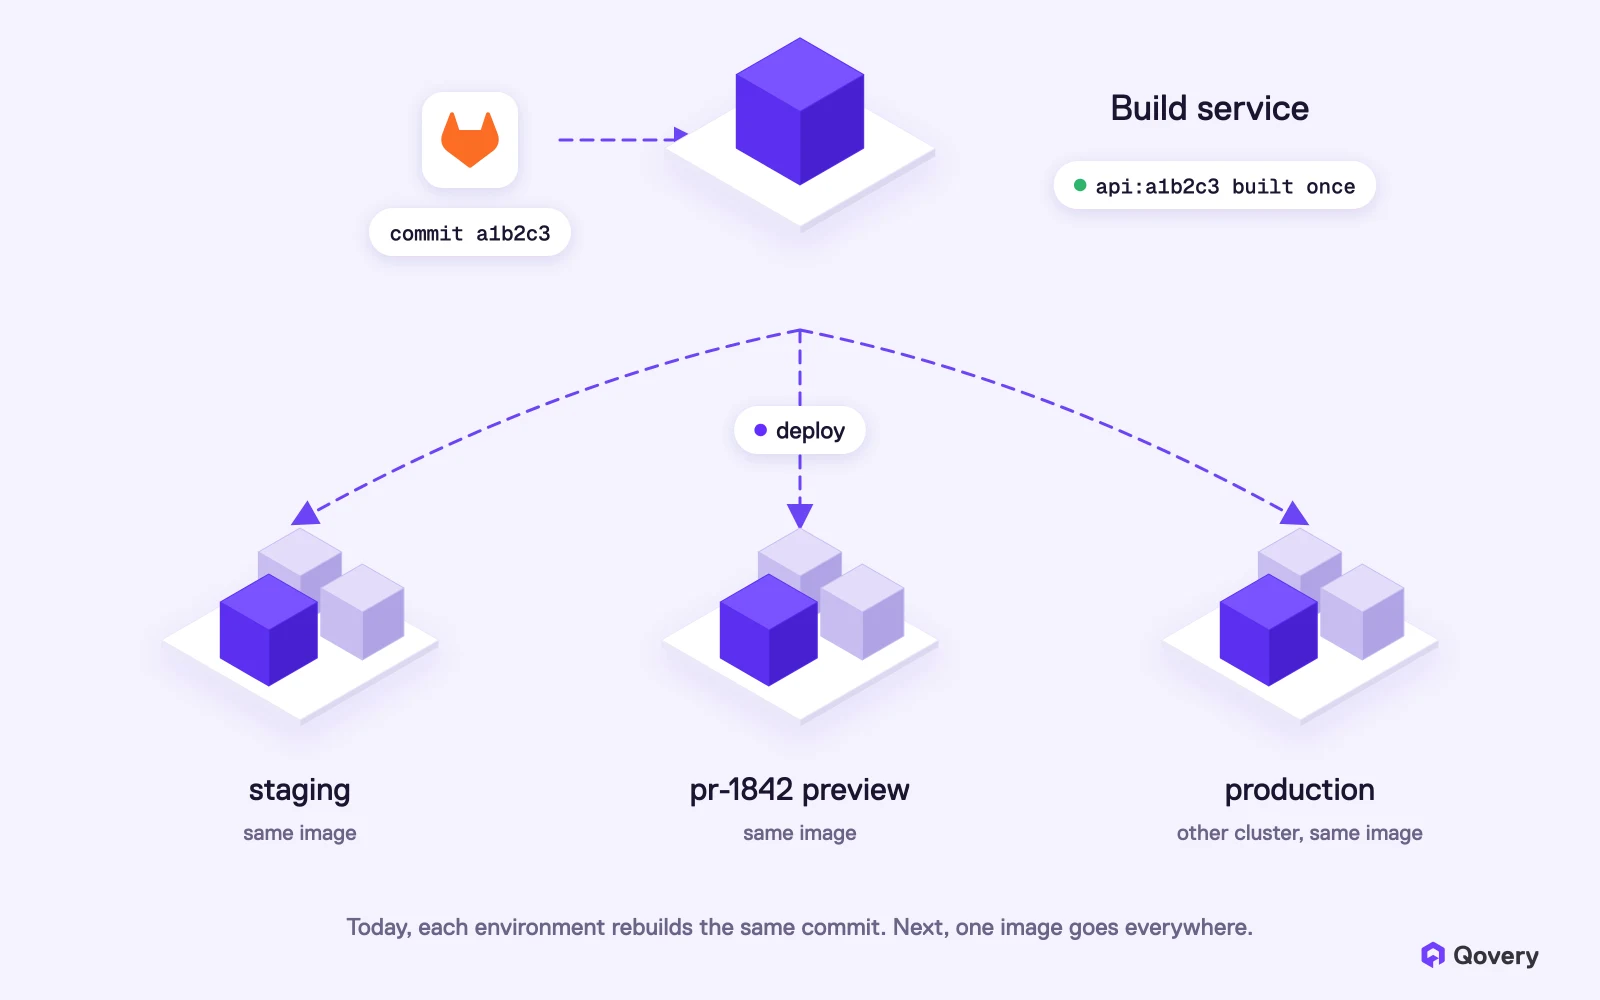
Build once, deploy many times. Our data shows that Qovery spends more than a third of application build time rebuilding images that already exist. Usually, the same code is deployed to many environments with small differences in build arguments, or production runs on another cluster. We are adding a dedicated build service, where each image has its own identity. You build an image once and give it a readable tag. Then you deploy the same image to any environment, and you promote the image you tested in staging to production. For these deployments, the build time is zero.
One build, one image, deployed to every environment.
Faster CPUs on the builders. Faster disks moved the bottleneck to the CPU. On builds over 400 seconds, the share of build hours limited by the CPU went from 7.5% on network disks to 22.7% on NVMe. Our builders do not use the newest instance generations yet. In a first test on one large open source project, a cold build took 339 seconds on a newer instance, against 469 to 502 seconds on the current one. We will run the full benchmark on both before we switch, and compare the price too.
Cache export off the critical path. Today, Qovery exports the build cache in the same step as the image push, so your deployment waits for it. Cache export and import are about 14% of the time in slow builds. We are testing two changes: start the deployment as soon as the image is pushed and export the cache after, and skip the export when every layer came from the cache.
A build cache that stays on the builder. Today, every build pulls its cache from the registry and pushes it back. We are looking at keeping the cache of each service on the builder's local disk, with the registry as a fallback. This removes the cache import and export, and keeps the content of RUN --mount=type=cache between builds, so package managers do not download the same dependencies again. Each service keeps its own cache, isolated from other services, as it is today.
Faster Git checkout and base images. Large repositories are still cloned in full on every real build, and every FROM pulls the base image from its upstream registry. We are measuring both per organization. If they cost what we expect, we will add a Git mirror per repository and a registry mirror for base images next to the builders.
Faster small builds. On very small builds, the remaining overhead is now a few seconds of setup and registry work, plus 12 to 14 seconds that our benchmark found outside any step. We are instrumenting those seconds first, then removing them, until the empty build is as fast as on GitHub.
Many builds at the same time. Today, a build waits 21 seconds or less in the queue in 95% of cases, so the queue is not the bottleneck. As agents start more builds at once, we watch this number and add builder capacity before it grows.
From advice to measured results. Today the Build Optimizer suggests a Dockerfile and you apply it. Next, we want to run the optimized Dockerfile next to yours and show you the real time saved, not only an estimate. Outside the Console, the qovery-speedup skill already gives your coding agent the same kind of analysis from your deployment history.
For the next benchmark, our goal is to be faster than GitHub Actions on every test project, including the empty build. After that, we will stop measuring at "image pushed" and start measuring at "code running". On Qovery, build and deploy happen in the same product, so you never wait for one tool to pass the work to another.
Try it on your own repository
All the platform improvements in this article are live, including buildx v0.39. The deployment logs and the Build Optimizer are live for a first group of customers. If you moved your builds away from Qovery in the past, try again now. Connect a service to your repository and compare the build time with your current setup. If your results are different from ours, please tell us. We use this feedback to decide what to improve next.
Thanks to Antoine Promerova and Romain Gérard, who measured, investigated and fixed these problems, and to Romain Billard and Théo Grandin, who designed the new deployment logs and the Build Optimizer experience.
Romaric founded Qovery to make Kubernetes accessible to every engineering team. He writes about platform strategy, developer experience, and the future of cloud infrastructure.
Next step
Build and deploy from one place, on your own cloud.
Our customers compared Qovery builds with GitHub Actions, and Qovery was slower. Here is what we measured on a public benchmark, what we fixed in October, why every build waited 30 seconds for nothing, the new Build Optimizer, and our plan to make Qovery the fastest way to go from a commit to running code.