

Overview
The Build Optimizer is in preview. The API below works for every organization with AI features enabled, as long as build analysis is available on its Qovery instance (otherwise starting an analysis returns
503, see Start Errors); the Console entry point is not available to every organization yet. The result format and the analysis itself may still change.npm ci, pip install, go mod download) runs on every deployment although your dependencies did not change. Typical causes are COPY . . placed before the dependency install, or a build argument declared before the install whose value changes between builds.
The analysis runs on demand, on one build, from the API or the Console. It is not a Copilot chat command. It never changes your Dockerfile, your build settings or your image: it returns suggestions for you to review and apply.
Requirements
Run an Analysis
From the Console
Where the Console entry point is available for your organization:1
Open the logs of the latest build
Open the service, go to Deployments, and open the logs of its latest deployment that ran a build. In the Console, the build must have succeeded; to analyze a failed build, use the API.
2
Start the analysis
On the Build step, click Optimize. The button shows Analyzing while the analysis runs; hover it to see the current step.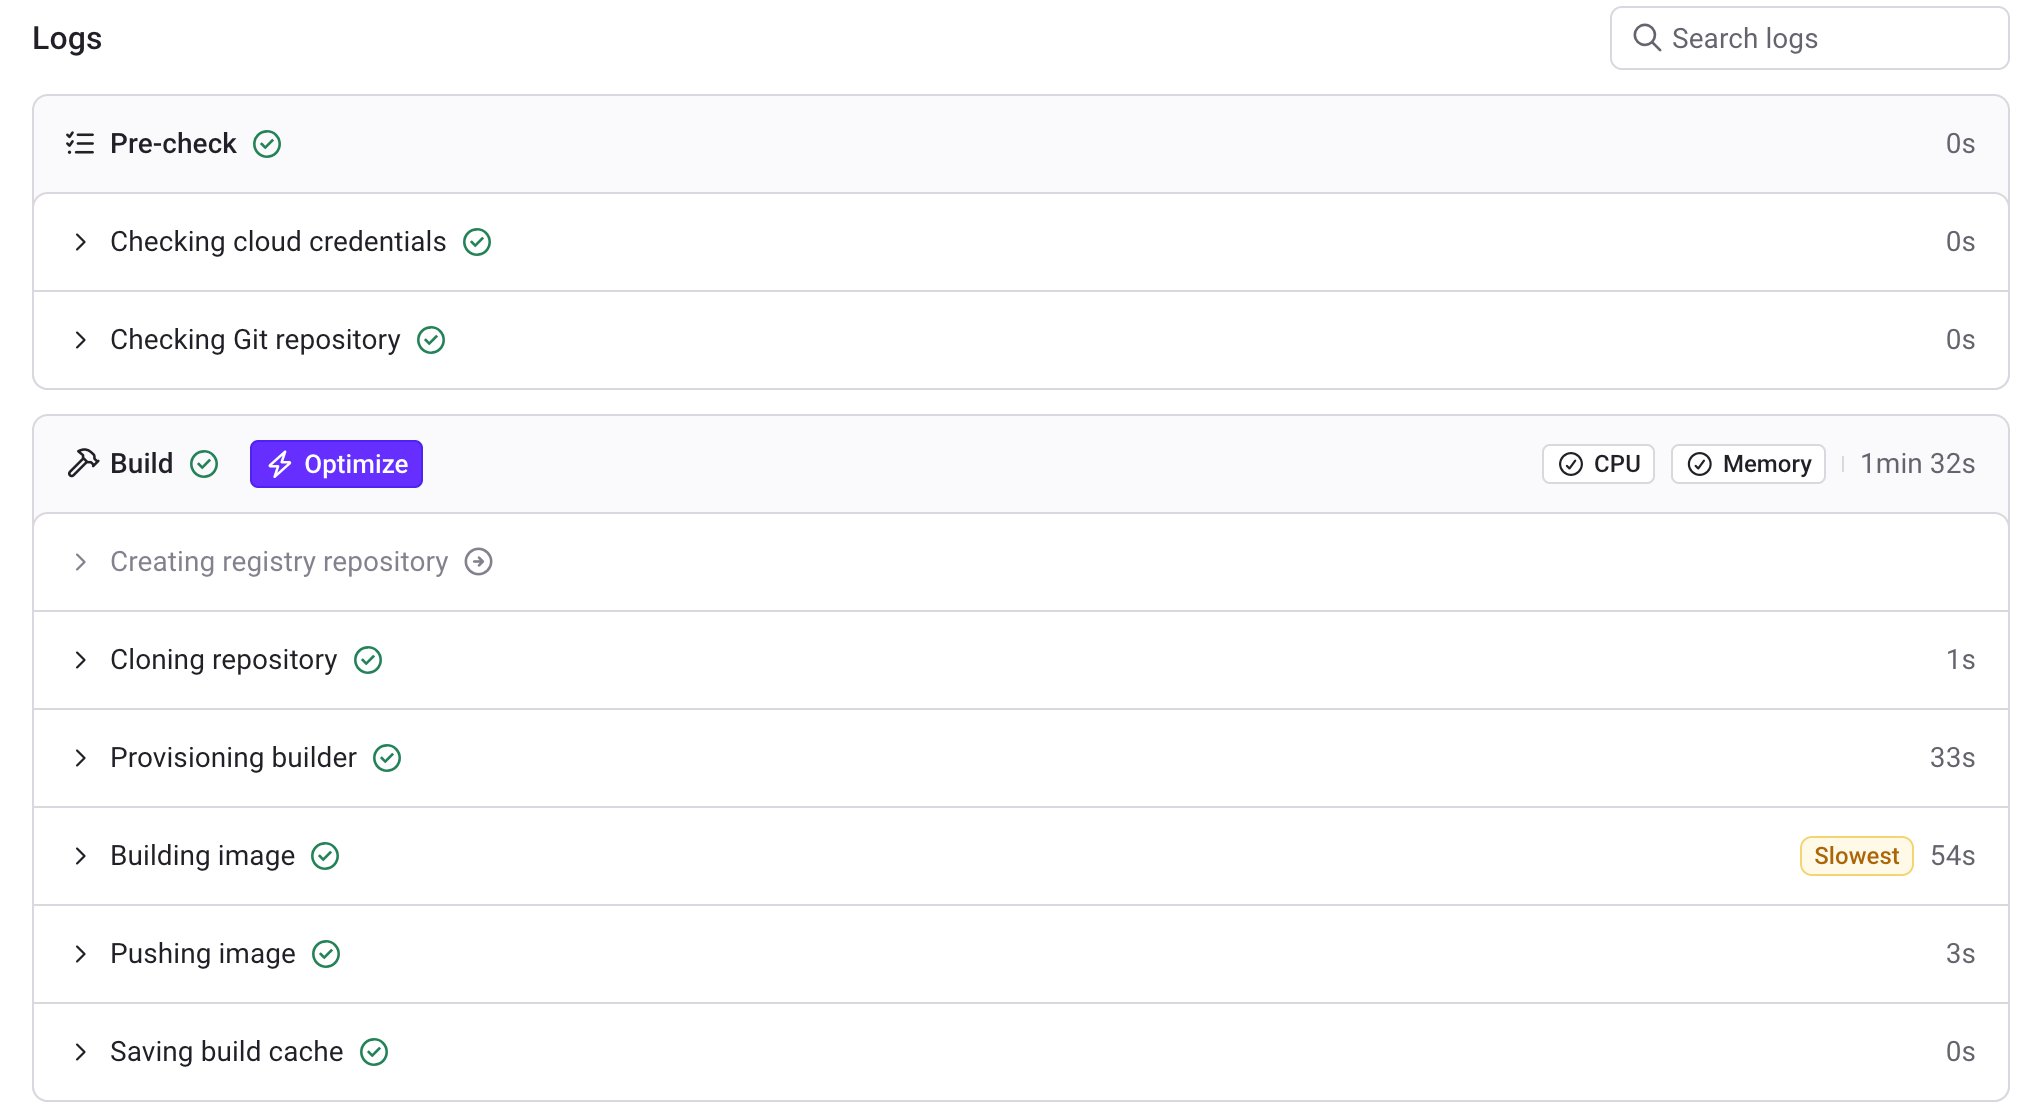
3
Read the result
The result opens by itself when the analysis you started is done. If it fails, an error message shows the reason. Later, the button reads Open analysis and opens the same result.The result shows the review confidence, the estimated time saved (when there is one), the assets reviewed, the summary and the Improvements target. Below them, Prompt for AI agents and Reworked Dockerfile (when the analysis returns one) are collapsed, each with a Copy button. Values hidden from the analysis appear as 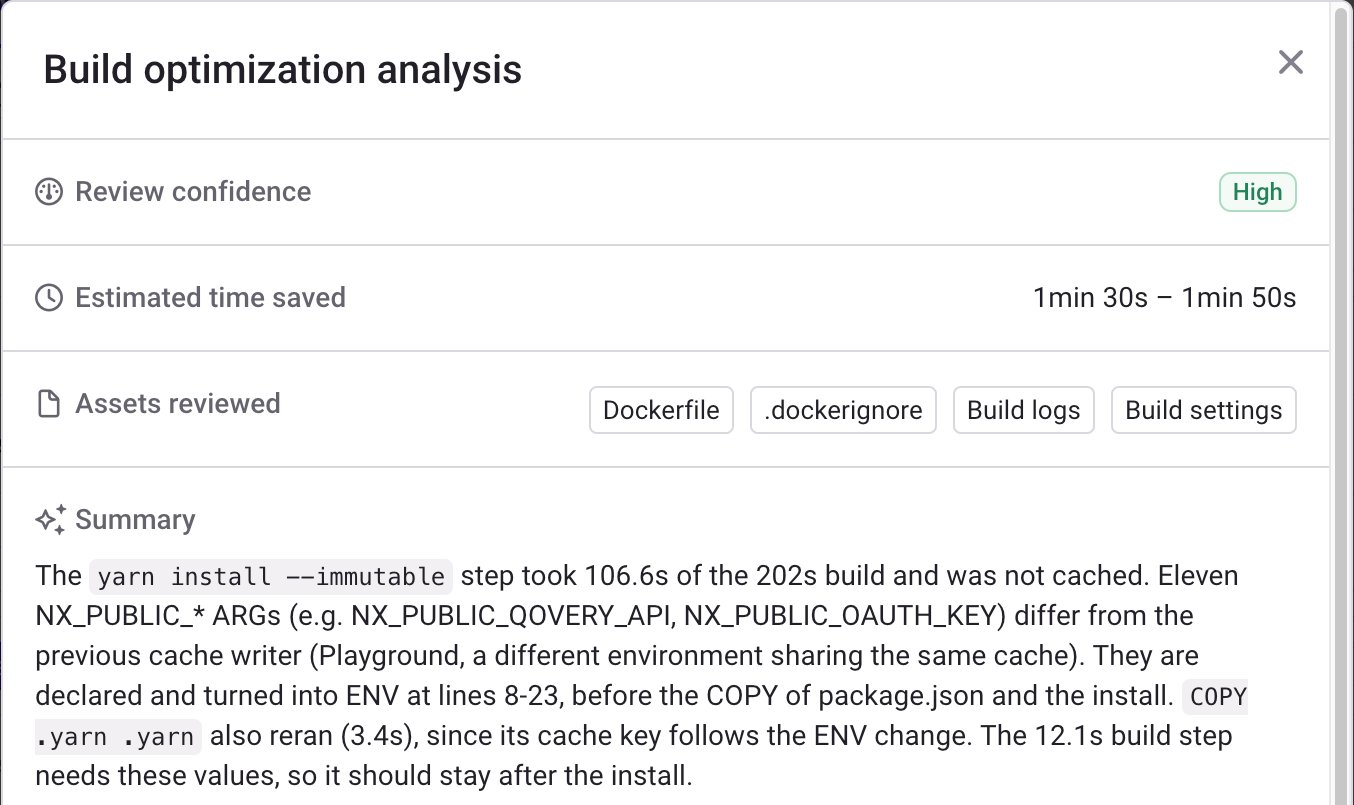
<redacted> in the reworked Dockerfile: put them back before using it.From the API
The examples use an application. For a cron or lifecycle job, setURL to https://api.qovery.com/job/$JOB_ID/buildAnalysis.
1
Get the latest build
Read the build analysis of the service.
latest_build_execution_id is the only build you can analyze, and analysis holds the previous analysis, if any.2
Start the analysis
Send that execution ID. The API answers Starting an analysis replaces the previous one of the service.
202 with the new analysis in PENDING, and the analysis continues in the background. Any other status means the analysis did not start: see Start Errors, and do not wait for a result.3
Wait for the result
Read the build analysis again until
analysis.status is DONE or FAILED. The loop prints each status. It also stops, and prints the error, when a request fails (for example an invalid token), and it stops on null when the service has no analysis.4
Read the result
Start Errors
Progress
If Qovery restarts cleanly during an analysis, the analysis fails with
INTERNAL_ERROR and failure_reason says so: start it again. If the Qovery process stops without warning, the analysis keeps its last status (COLLECTING or ANALYSING) for up to 11 minutes, then reads as FAILED with TIMEOUT. During those 11 minutes, starting a new analysis returns 409.
Follow progress live with the websocket route
Follow progress live with the websocket route
Progress is also streamed on the websocket route Past events are replayed first, then new ones as they come.
/build/analysis of wss://ws.qovery.com, with the query parameters organization, cluster, project, environment and service (all IDs). It needs the same access as the service logs.Each frame is one progress event:message explains a failure. The connection closes with code 1000 after the event with "terminal": true (DONE or FAILED). Without that event, it closes with 1011 when the progress is unavailable, or 1001 after 15 minutes. Read the build analysis to get the result.What the Analysis Reviews
The analysis also reads the cache history: up to 10 earlier builds that can have written the cache this build started from. The layer cache is shared by every build of the same repository, root path, Dockerfile and target stage on the same cluster, whatever the branch or environment. The history only includes builds of your own organization. So the history includes earlier builds of the service and builds of other services built from the same repository, for example the same application in another environment. When those builds alternate, each one can start from a cache the other overwrote.
For each build argument, the analysis learns whether its value differs from the build that last wrote the cache, and how many distinct values it has across the services sharing the cache. Qovery compares the values itself and sends only the result.
assets_reviewed in the result lists what was available for this analysis.
What You Get Back
The analysis itself also carries
execution_id (the analyzed build) and stale, which is true once the service has a newer build than the analyzed one.
Confidence
The confidence says how sure the analysis is that applying the improvements saves the estimated time.
When there is no improvement, the confidence says how sure the analysis is that the build has nothing left to gain.
Apply the Result
1
Review the analysis
Read the summary and the improvements. The analysis is a suggestion: check that each change keeps your image behaving the same way.
2
Apply the changes
Use either:
- Copy the reworked Dockerfile from
dockerfile, when the analysis returns one. Values hidden from the analysis appear as<redacted>: put back the values of your original file before you commit. - Paste
agent_promptinto your coding agent. It names the files and the exact changes, asks the agent to keep the image behavior identical, to put back any<redacted>value, to build twice locally and check the second build hits the cache, and to stop for your review before committing or deploying.
3
Deploy and compare
Commit, then deploy. The first build after a Dockerfile change re-runs the changed steps, so compare the build time on the builds after it. You can run a new analysis on the latest build to check what is left.
Limits and Data Handling
- Suggestions only. Qovery never changes your Dockerfile, your build settings or your image. Starting an analysis never triggers a build.
- Latest build only. Only the latest build of a service can be analyzed. Qovery keeps one analysis per service: a new analysis replaces the previous one, and the kept one is marked
staleonce a newer build exists. - AI model. The analysis runs on an Anthropic Claude model through Amazon Bedrock, called by Qovery.
- Dockerfile values are hidden. Before the Dockerfile is sent, every literal
ARGandENVvalue is replaced with<redacted>(references such as$NODE_ENVare kept). So are credential-like strings: AWS access key IDs, GitHub, GitLab and Slack tokens, npm auth tokens, private keys, credentials in URLs andAuthorizationheader values. - Secret values are masked. The values of the service’s secret variables are masked in the Dockerfile and the build logs before they are sent, and in the stored result. Values shorter than 6 characters are not masked.
- Build arguments are compared, not sent. The analysis receives their names and whether their values changed between builds. Non-secret values can still appear in the build log lines that are sent, where BuildKit prints them.
Related
Build-Time Variables
Pass variables as build arguments or build secrets.
Build Settings
Build timeout, resources and BuildKit cache.
Deployment Logs
Read the build logs of a deployment.
Build & Deployment Optimizer
Agent Task that reviews build and deployment times and opens pull requests.