TL;DR: We discovered the hard way that when backtrace is enabled, the anyhow library is capturing a backtrace on every error. Only when printing this error in debug format!(”err: {:?}”, error) backtrace’s symbols are resolved to human-friendly names, thus leading to a significant memory increase for your application. If you need backtrace only on panic, you must set two environment variables, RUST_BACKTRACE=1, and RUST_LIB_BACKTRACE=0, to avoid the issue.
At Qovery, we have a fairly small service called engine-gateway that handles connections and data transmission with our clients' deployers. This service has a relatively low memory footprint, as its responsibilities are mainly authentication/authorization and streaming bytes forward into a data store for processing.
This engine-gateway has been running fine for months in production without any intervention at a memory usage < 50Mib. Until one day…
That day, we were automatically alerted on Slack that this service had been restarted abruptly and that someone must investigate why.
We reached the service dashboard, but nothing stood up. CPU, memory, network, threads, file descriptors, number of requests… all resources were checked before the crash. Also, there was nothing in the application logs just before; it was all as if the app had been restarted without any reason.
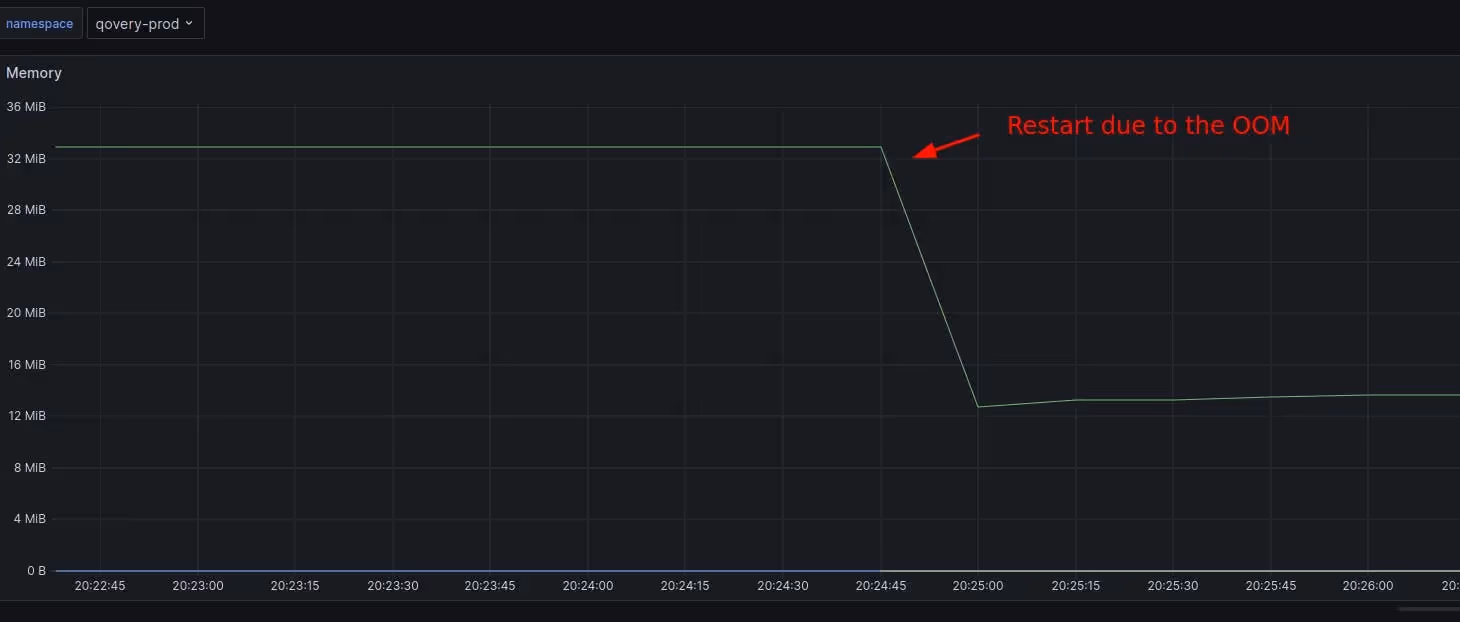
This service runs on Kubernetes, so we checked the pod's status and found out the last reason for the restart was an out-of-memory (OOM), meaning that the application used more memory than the limit we set.
But it felt strange because in our dashboard, the memory consumption of the engine gateway was pretty stable before the crash, and even in general, there was no spike. Also, no slow increase/march of death would indicate a memory leak.
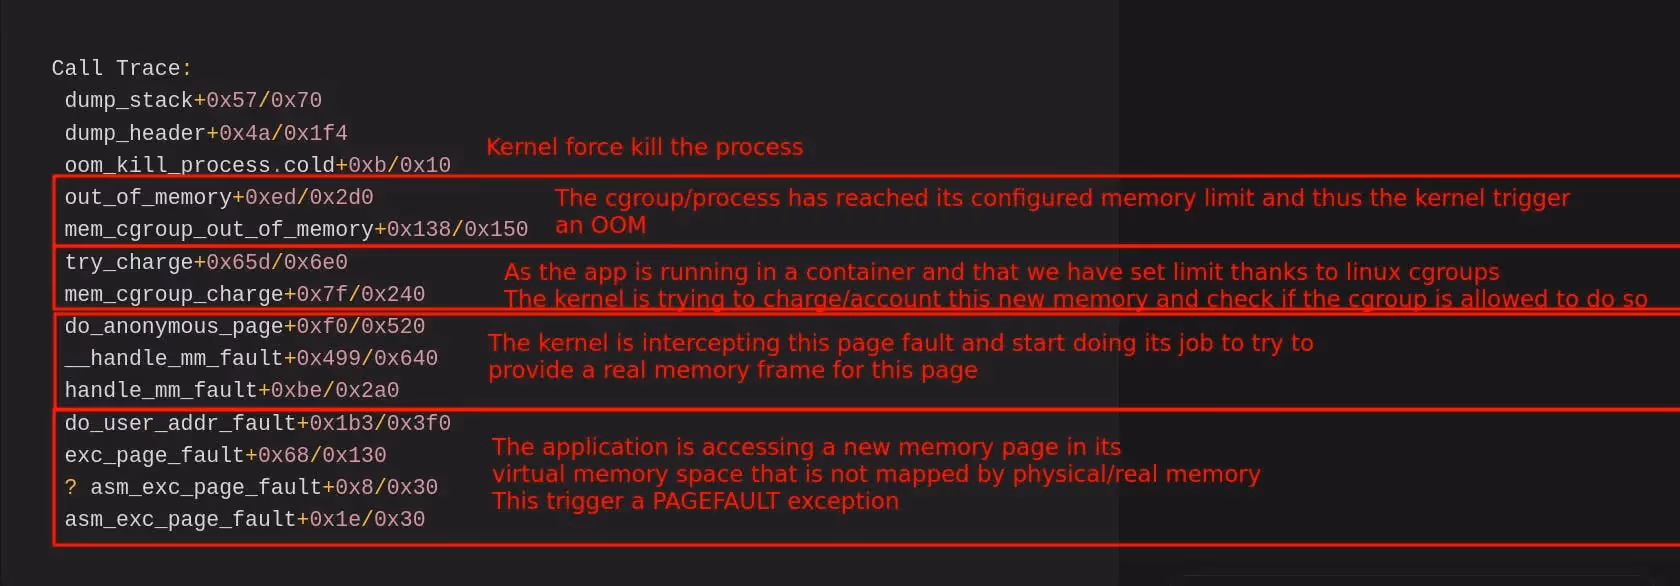
So, to convince ourselves, we dug deeper and connected directly to the node to retrieve the kernel message regarding the OOM. And indeed, dmesg command was greeting us with this.
Let’s unpack it a bit. The stack trace is reasonably normal for an OOM. Reading from bottom to top.
OOM stack trace - page fault flow from bottom to top
This page explains page faults and how they are linked to virtual memory in Linux.
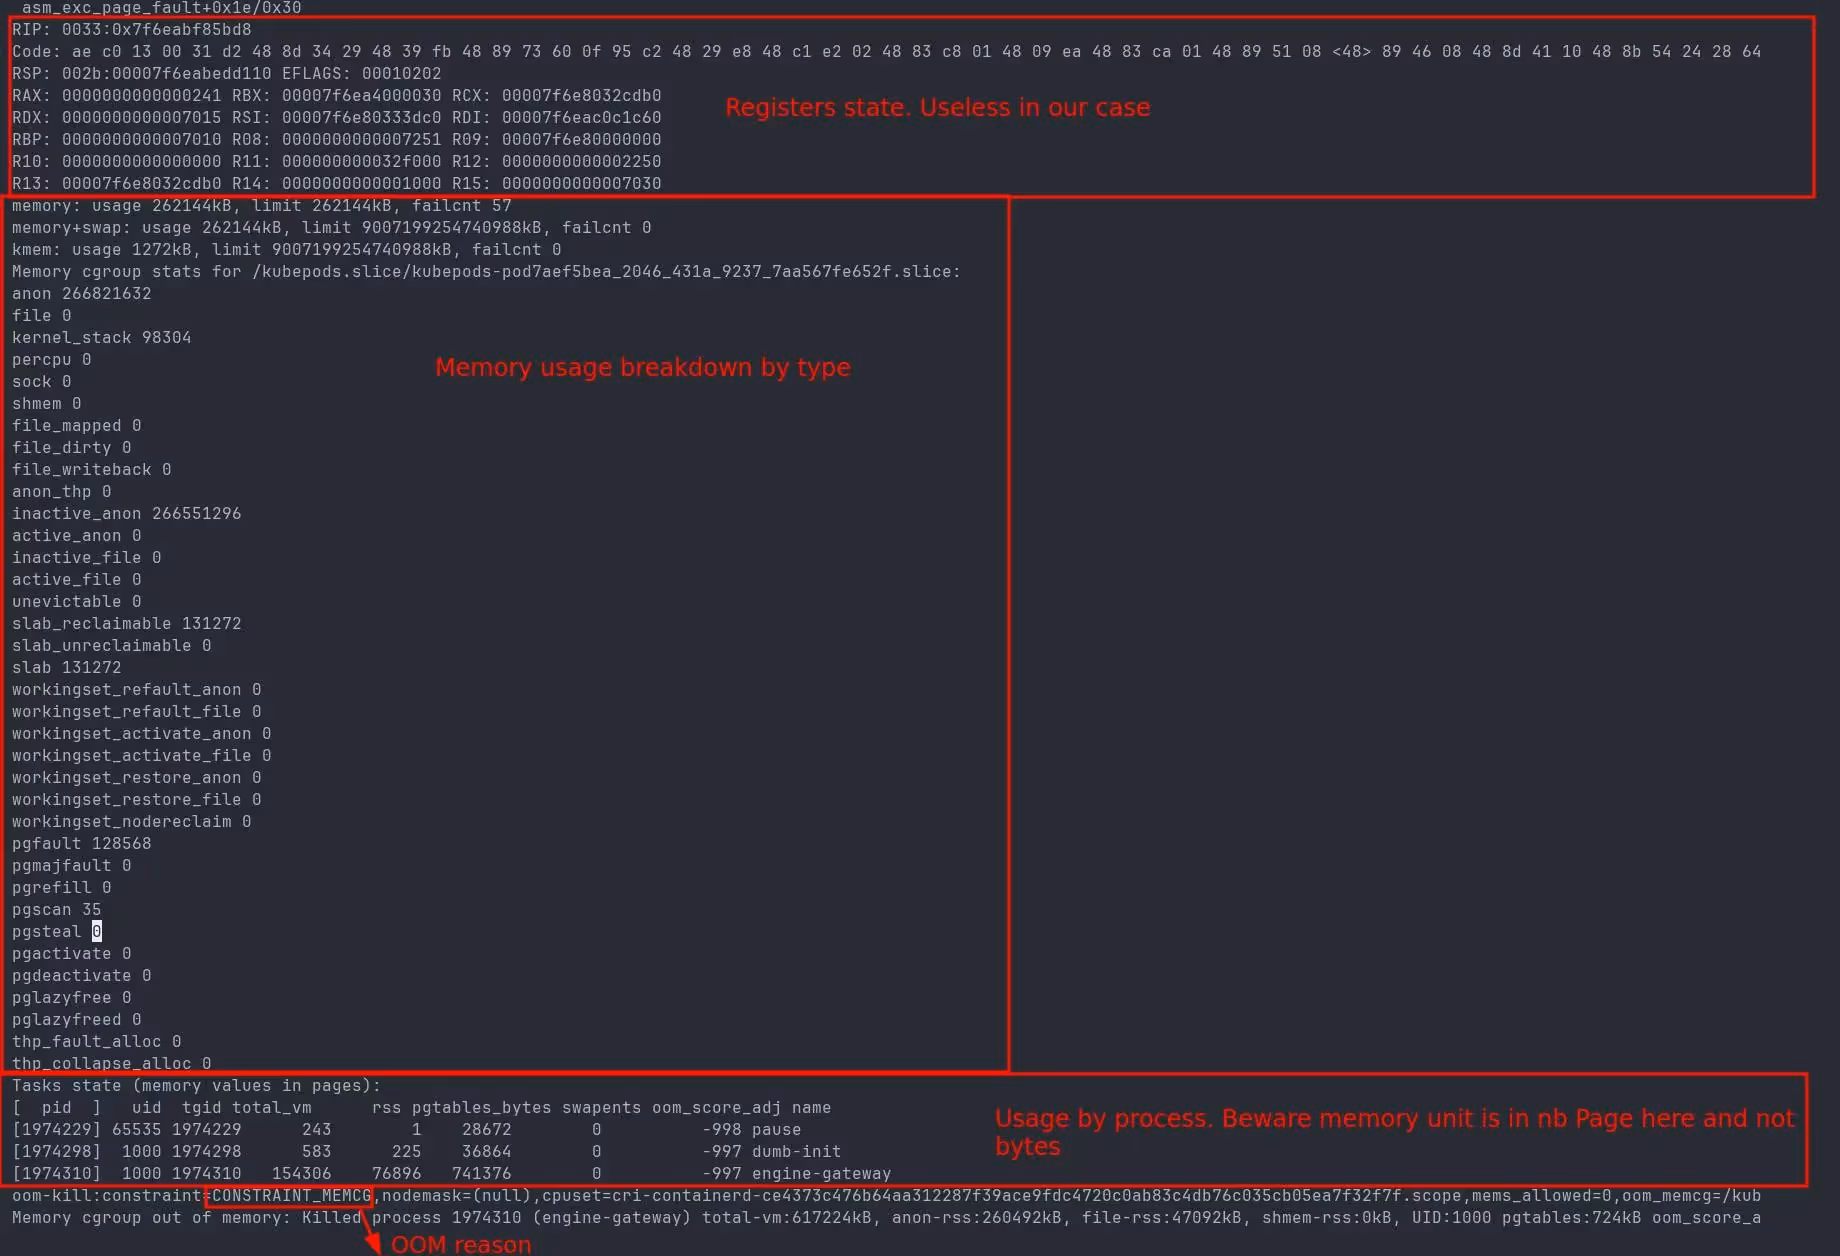
OOM trace showing memory breakdown by process
The OOM trace gives some helpful information to narrow down the culprit.
If we look at the breakdown by process, we see that the engine-gateway process is clearly using too much memory. Pause is an internal process for Kubernetes, and dumb-init, which helps manage signals, is not in cause.
The 2nd information is that the memory allocation is for anon(ymous) page, which is the kind of memory used by malloc/free standard libc allocator.
This OOM trace proves that this is the code of our engine gateway that is allocating too much for some unknown reason. More importantly, our monitoring is hiding the truth. The memory surge is so quick that the process is instantly killed without our monitoring being able to report the increase. Our monitoring frequency is set at 10sec, so everything happens under those 10sec.
At this point, we were stuck investigating further. We are running this service with multiple instances, so the crash of one instance is not causing any outage. We control both ends of the service, so we don’t expect any big payload that would cause such an abrupt spike, and clients are able to resume even after an error.
So without any traces to dig in deeper in the code, we decided to let the problem sit, as we were busy with other matters at the time. We only doubled the memory limit of the service in order to catch the issue live if it happens again.
Memory dashboard showing the OOM happening again after doubling the limit
Several weeks later, it happened again. This time, in spite of doubling the memory limit, the OOM propagated at the same time during the night to all running instances of the engine gateway, creating a real outage… To add to the worst, we were left without much more information than the first time.
This time, we took the problem at hand. We increased the engine gateway's memory limit to 4Gib and changed our code to investigate the memory allocation issue.
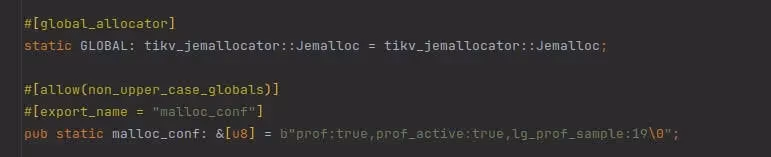
By default, the libc memory allocator does not provide profiling information that is easily exploitable, so we changed to using the venerable jemalloc so that when we catch the issue live, we can investigate where the allocations are coming from.
For that, we used the crate rust-jemalloc-pprof to retrieve profiling information in pprof’s format and generate a flame graph of allocations.
The change is pretty straightforward in Rust, and well explained in the article. Adding a crate and those lines is enough to use jemalloc in place of the default allocator.
Rust code to set up jemalloc as the global allocator
We released everything, and one more time, we waited for blood to be spilled…
Dashboard showing memory spike above 400MiB
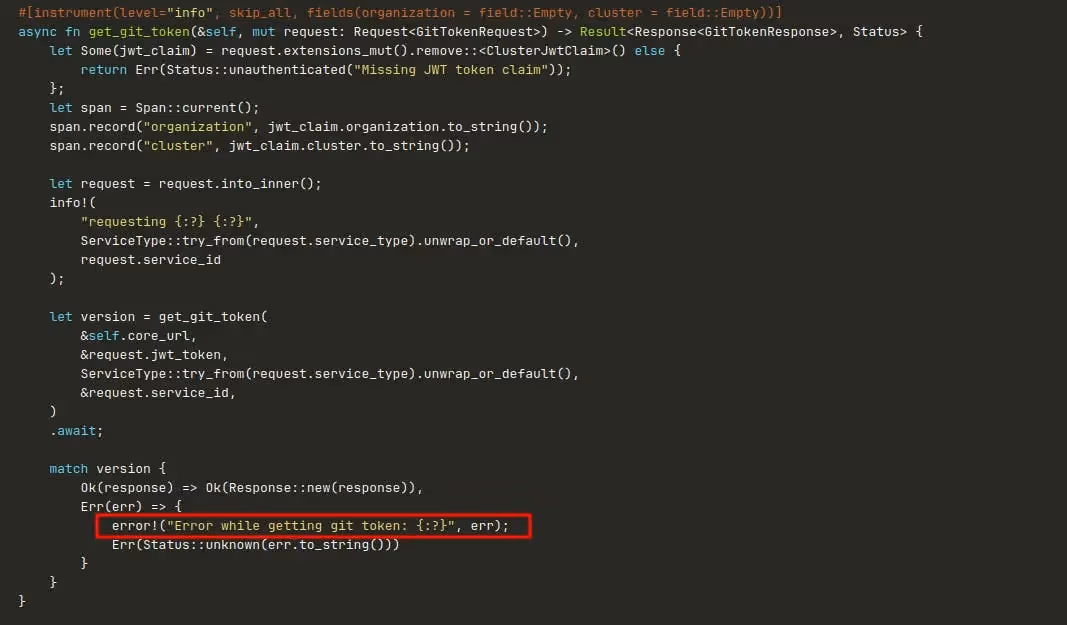
This time, we got lucky. We only had to wait several days for the issue to arise again. We saw in our dashboard that the memory increased by more than 400Mib, only to discover that the root cause of the issue was this line of code, which only logged an error.
The cause of our OOM
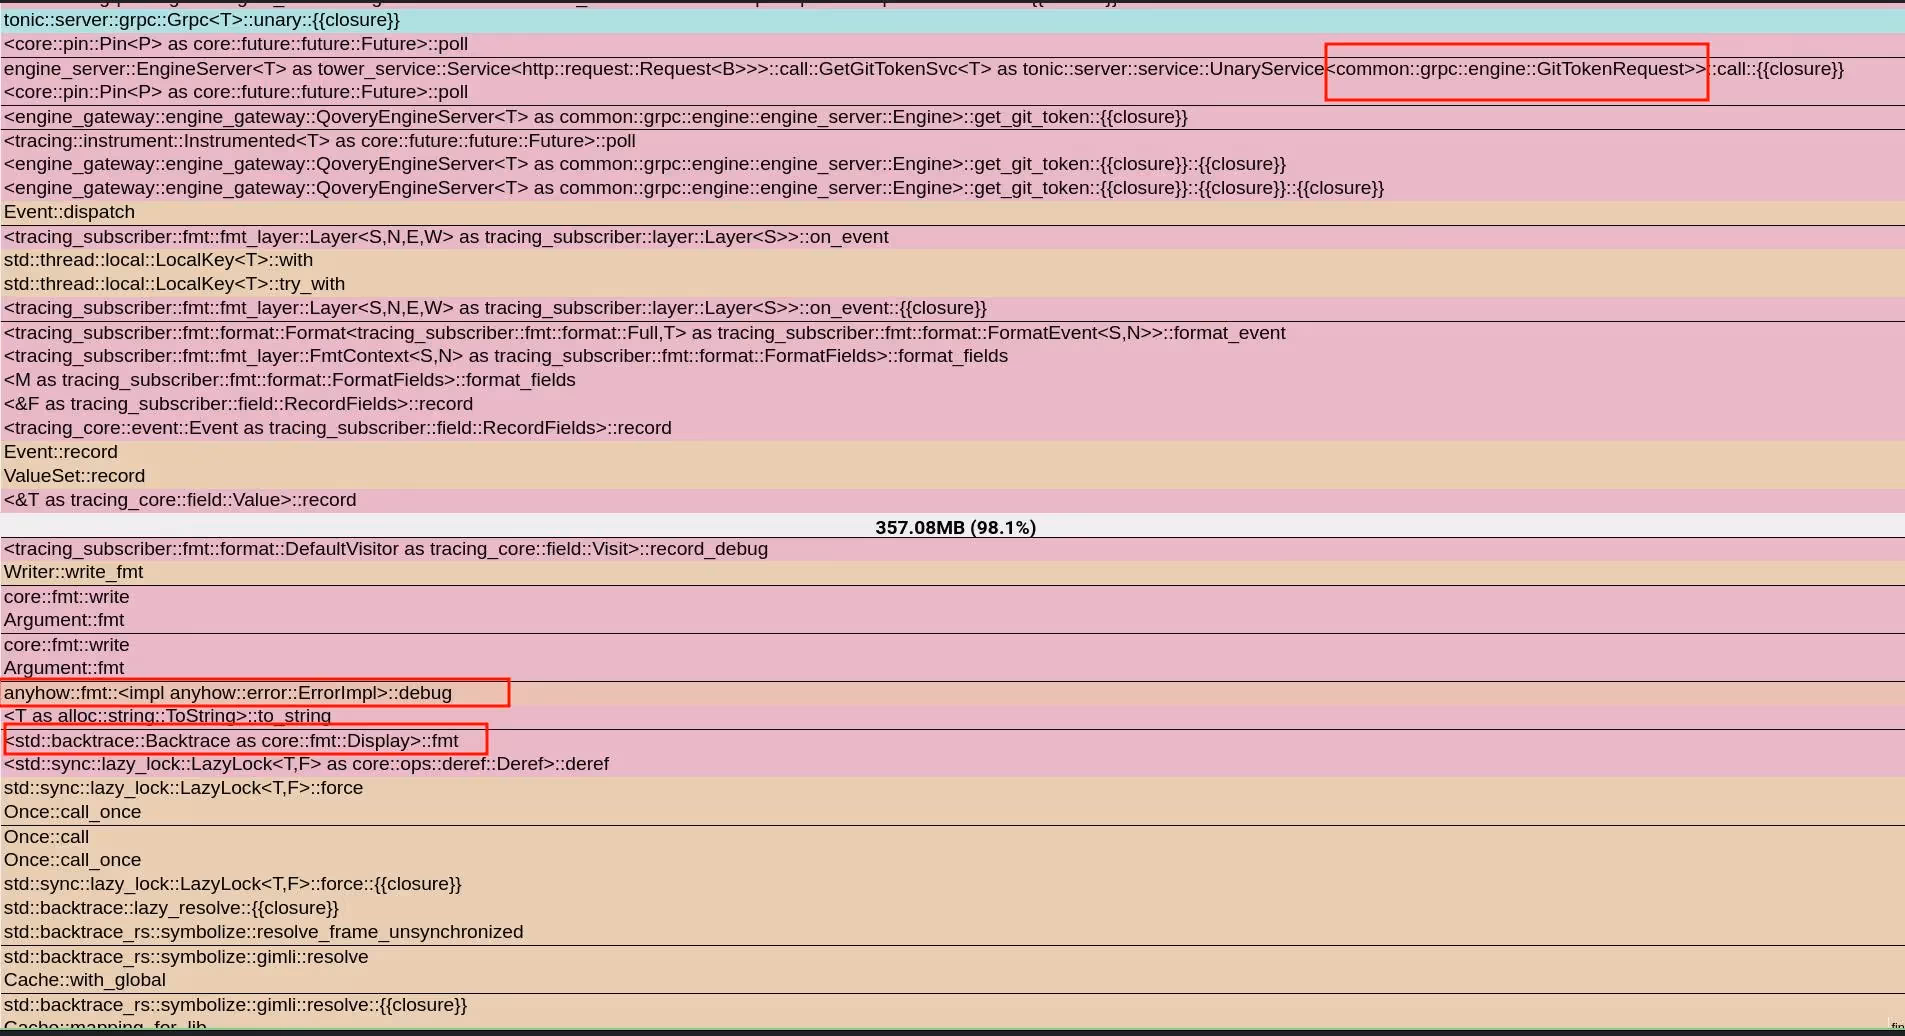
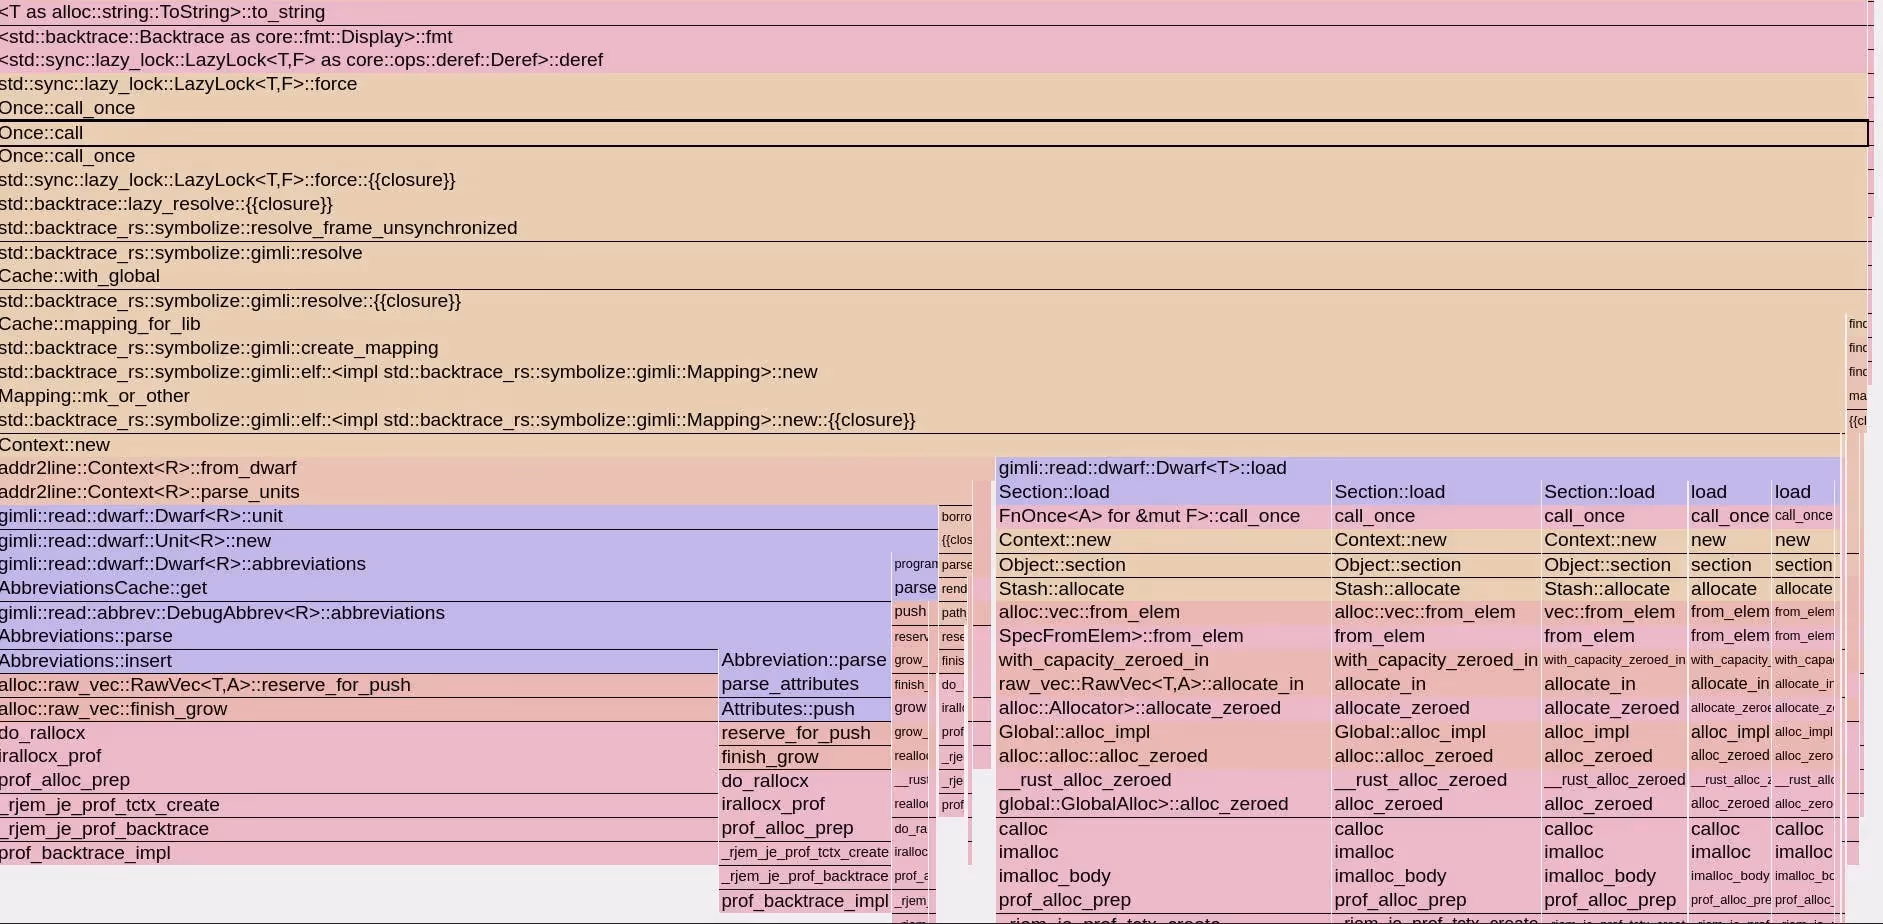
Looking at the profiling information of the allocation thanks to jemalloc, we can now clearly see what is happening.
jemalloc profiling showing anyhow Debug triggering symbol resolution
We use anyhow crate to manage errors in our application, and we see that calling the Debug implementation for anyhow::Error triggers the symbolization of a backtrace and caches it. The implementation is trying to resolve the symbols of a backtrace to give them human-readable names so that they can be printed.
But why? How? Our first surprise was to discover that when backtrace is enabled, the anyhow library is capturing one on every error created. The second surprise was that we use anyhow pretty much everywhere in this service, and it is not the single path in the code where we log an error. So why does this code path trigger a symbolization and lead to OOM? Because it is the single path where we print it in Debug and not in Display, so only this code path triggers the issue…
This line would not have caused the issue.
RUST
error!("Error while getting git token: {}", err);
But this line, yes
RUST
error!("Error while getting git token: {:?}", err);
See the issue? Pretty subtle.
After looking at anyhow issues, we discovered that it was a common pitfall and that it is even mentioned in the documentation, but with unclear consequences for the profane
If using Rust ≥ 1.65, a backtrace is captured and printed with the error if the underlying error type does not already provide its own. In order to see backtraces, they must be enabled through the environment variables described in std::backtrace:
If you want panics and errors to both have backtraces, set RUST_BACKTRACE=1;
If you want only errors to have backtraces, set RUST_LIB_BACKTRACE=1;
If you want only panics to have backtraces, set RUST_BACKTRACE=1 and RUST_LIB_BACKTRACE=0.
So the fix was easy, not even involving changing code, as we are only interested in backtraces during panic; we restarted the engine-gateway with this extra environment variable RUST_LIB_BACKTRACE=0.
Agents ship fast. Guardrails keep them safe.
Qovery ensures every agent action is scoped, audited, and policy-checked. Start deploying in under 10 minutes.
Romain is a staff engineer at Qovery working on the control plane and AI integrations. He writes about distributed systems, incident response, and MCP-based tooling.
Next step
Agents ship fast. Guardrails keep them safe.
Qovery ensures every agent action is scoped, audited, and policy-checked. Start deploying in under 10 minutes.