The DevOps Guide to Docker Monitoring: Tools, Best Practices, and Unified Observability
Stop tool sprawl. Compare top Docker monitoring tools (Prometheus, Datadog, Qovery) and learn how unified observability simplifies K8s debugging and speeds up feature delivery.
Docker Monitoring is Essential for Performance and Risk Mitigation: Real-time monitoring of Docker containers is crucial for achieving ideal application performance, enabling secure changes by watching the entire environment, and proactively detecting and resolving issues to avoid production risks.
The Monitoring Market is Split Between Components and Platforms: The ecosystem includes robust open-source components that require manual integration, and specialized proprietary tools for deep APM. The key challenge for DevOps is choosing between flexibility (open-source) and specialized features (proprietary).
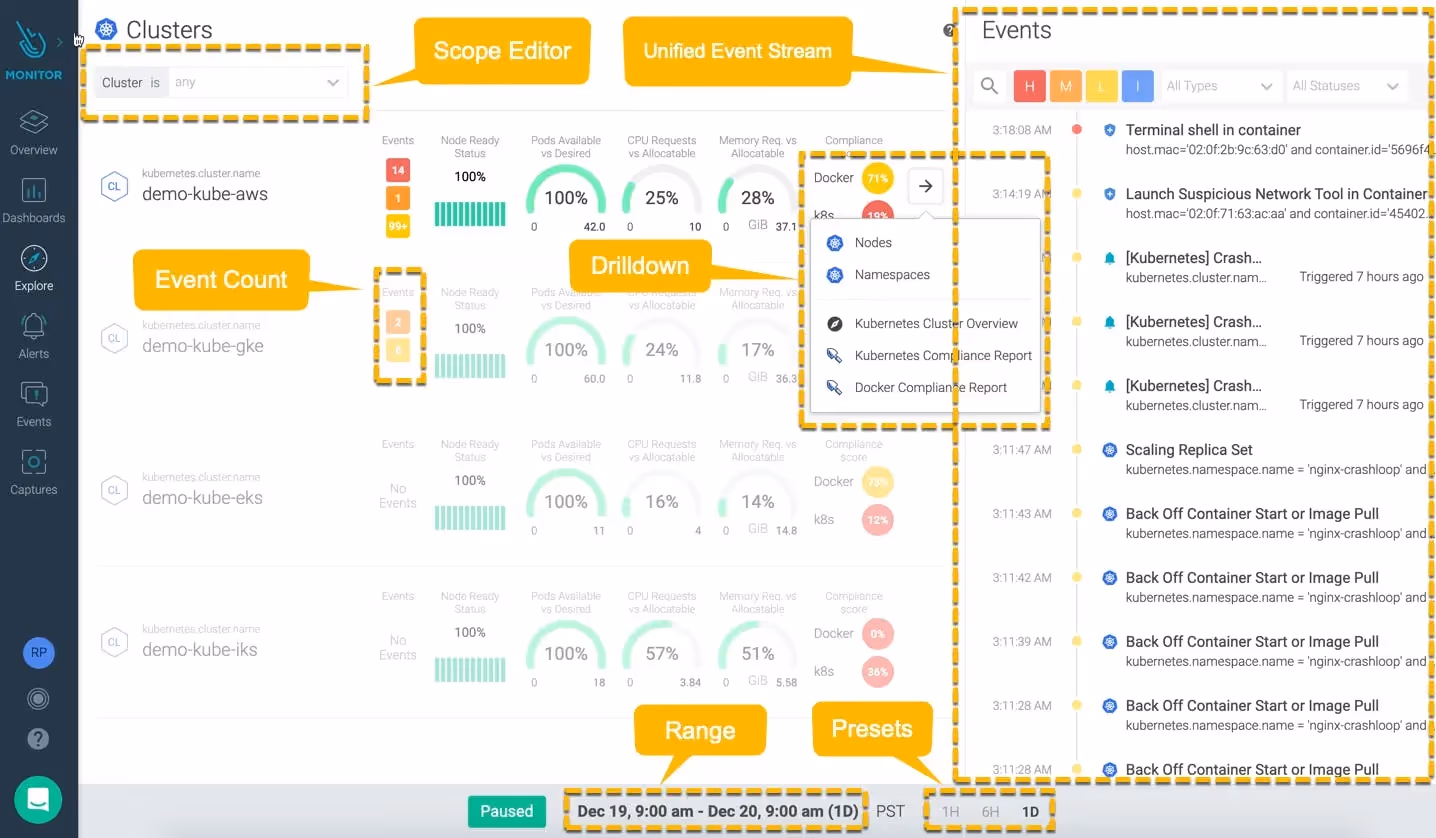
Qovery Solves the Context-Switching Problem with Integrated Observability: Qovery differentiates itself by offering a unified, developer-centric platform that integrates logs, metrics, and alerting directly into the deployment console. This eliminates the need for DevOps teams to manually stitch together separate tools and allows developers to trace an issue from a failing pod back to the specific deployment that caused it.
Containers are Dynamic. Is Your Monitoring Keeping Up?
Your applications are running on Docker, but your DevOps team is drowning in monitoring sprawl. The problem isn't the container - it's the complexity of stitching together Prometheus, Grafana, and an Alertmanager just to get basic visibility. In a cloud-native world, performance bottlenecks and production risks are hiding in plain sight.
You can't afford a blind spot. Real-time observability is the only way to proactively detect issues, secure environment changes, and keep your application performance tuned to perfection. This guide cuts through the noise to evaluate the top open-source and proprietary Docker monitoring solutions, showing you how to achieve reliable, unified observability without adding more operational overhead.
Data Monitoring Solutions for Docker
There are a variety of data monitoring solutions available for your Docker containers. In the following sections, review several open-source and paid tools to learn about some of the finest container monitoring technologies available today.
The following factors were considered in evaluating the best tools for Docker monitoring as discussed in this article:
Open-source/free availability
Good customer support
Great alerting solutions
Ability to provide a comprehensive data model
Native support for Docker containers
Least security concerns
Easiest approach to monitor Docker containers
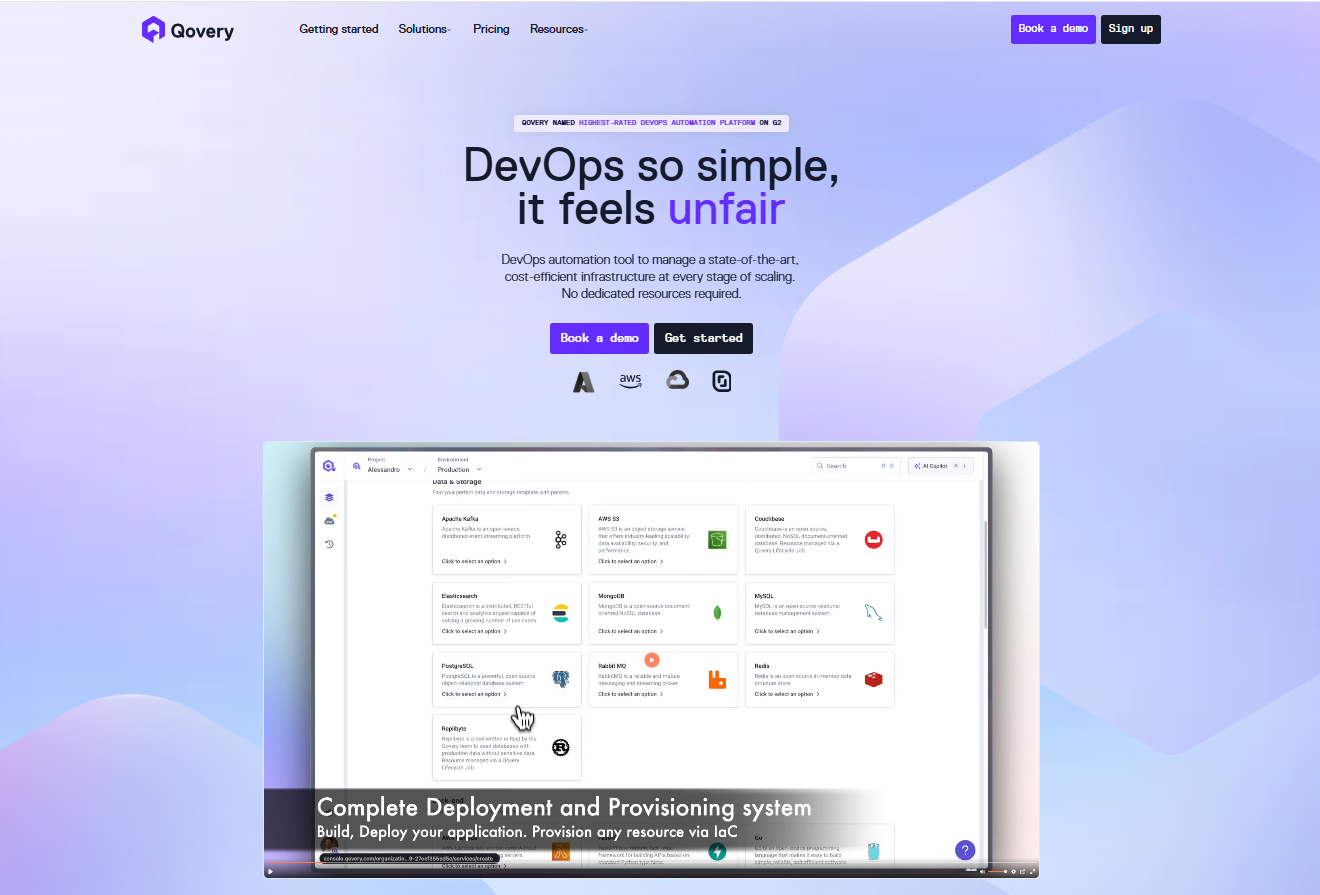
1. Qovery - A Unified Kubernetes management platform for Deployment, Monitoring, and DevOps
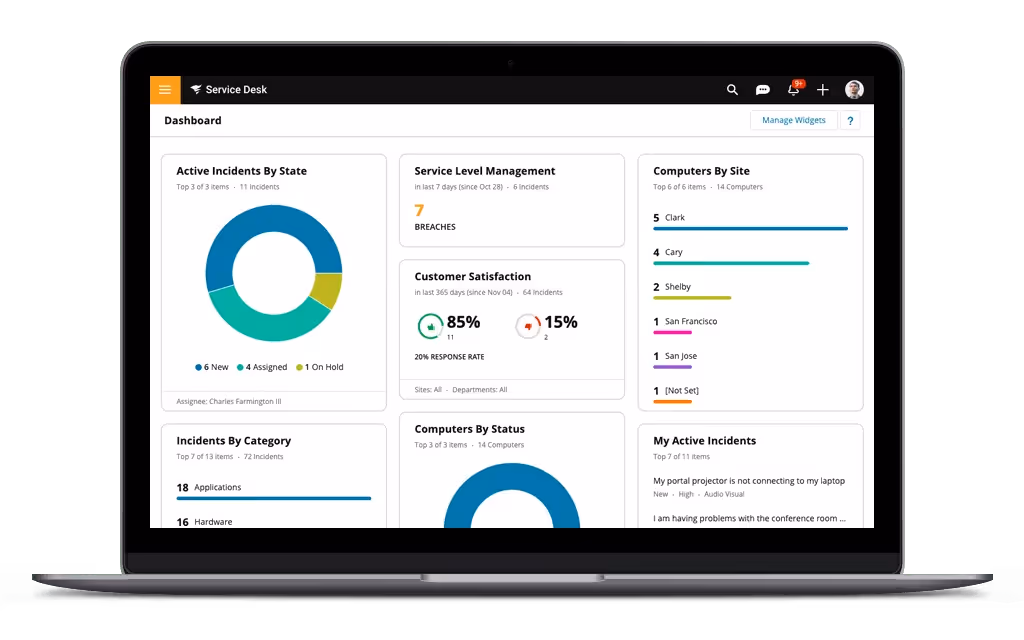
Qovery is a Kubernetes management platform that simplifies application deployment and management on your own cloud. Beyond its core function of providing easy deployment on Kubernetes, Qovery includes a fully managed observability suite. This allows developers to get a unified view of their application's health, logs, and metrics directly within the Qovery console, eliminating the need to switch between multiple tools for troubleshooting.
Qovery has a mixed model, combining both open-source and proprietary elements.
Open-Source Core: A significant part of Qovery's technology, including its core deployment engine, is open-source. This engine is what enables the deployment of applications on various cloud providers and is available on GitHub. This open-source foundation is a key part of Qovery's strategy to provide transparency and avoid vendor lock-in.
Proprietary Platform: The full Qovery platform, which includes the web console, integrated observability, advanced features for teams and enterprises, and a streamlined user experience, is proprietary. This is where the company's business model is based, offering various paid plans (Team and Enterprise) that provide managed services, support, and additional features on top of the open-source engine.
Key Features:
Unified Observability: A single, integrated console for logs, metrics, and events.
Smart, Integrated Alerting: Proactive alerts with notifications via UI, Slack, and email based on key metrics.
Developer Autonomy: Built directly into the Qovery UI, empowering developers to troubleshoot issues without needing deep DevOps intervention.
Data Ownership: All data (logs, metrics) is stored in your own cloud account, under your control.
Open Source Foundation: Powered by trusted open-source tools like Prometheus and Loki, but managed and maintained by Qovery.
How is it different from other monitoring tools?
Unlike standalone monitoring solutions such as Datadog or Prometheus, Qovery's observability is part of a larger application deployment platform. This integration is its key differentiator. It correlates application metrics and logs directly with deployment history and configuration changes, allowing a developer to trace an issue from a failing pod back to the specific code deployment that caused it-all from a single interface.
While you can integrate Datadog with Qovery, Qovery's built-in solution is designed to provide this seamless, "no-context-switch" experience out-of-the-box.
Pricing:
Qovery's observability features are included within its platform tiers.
Free tier: Provides access to basic features.
Team and Enterprise plans: Offer enhanced features and are priced based on usage.
Strengths:
Seamless Integration: Correlates deployment events with monitoring data automatically.
Ease of Use: Removes the complexity of setting up and maintaining a separate observability stack.
Developer-Centric: Designed to empower developers with the tools they need to debug and manage their applications independently.
Weaknesses:
Not a dedicated APM tool; it may lack some of the advanced features of highly specialized platforms like Datadog or New Relic.
It is a broader platform, so teams who only need a standalone monitoring solution might find it more comprehensive than necessary.
Open-Source Options
Open-source tools are generally much more cost-effective than proprietary solutions and provide a great deal of flexibility and agility. They also provide the opportunity to start small and quickly with community versions of open-source tools. Take a look at a few of the best open-source solutions for monitoring your Docker containers.
2. Prometheus
SoundCloud developers created Prometheus, an open-source monitoring system, in 2012. We have chosen Prometheus as its monitoring system comes with a comprehensive, multidimensional data model as well as PromQL, a short and powerful query language.
Existing metrics from third-party systems can be exported as Prometheus metrics using a variety of libraries and servers. This is useful in situations where directly instrumenting a system with Prometheus metrics is not possible.
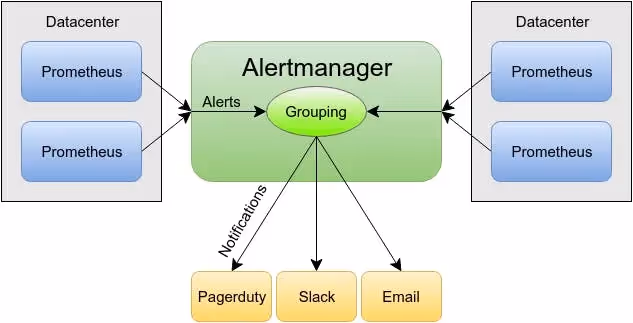
Prometheus and Alertmanager
There are two stages to alerting using Prometheus. Alerts are sent to an Alertmanager by Prometheus servers’ alerting rules. The Alertmanager then takes over the management of those alerts, including silencing, inhibition, aggregation, and communication via email, on-call notification systems, and chat platforms.
The Docker Hub Exporter for Prometheus exposes metrics from the Docker Hub API, such as container pulls and stars, to a Prometheus-compliant endpoint. The exporter can retrieve statistics from DockerHub for particular images, organizations, or people.
The Docker Cloud Exporter is a Prometheus-compatible endpoint that exposes the health of stacks, services, nodes, and node clusters via the Docker Cloud API.
3. cAdvisor
cAdvisor, which stands for Container Advisor, is an open-source tool developed and maintained by Google. cAdvisor is a daemon that collects container monitoring data in real-time. We have chosen cAdvisor as it comes with native support for Docker containers and is ready to use with additional container environments, like Kubernetes. It is also available as a stand-alone installation.
cAdvisor can collect useful data analytics on every operating container, including CPU, memory, file system utilization, real and virtual network interfaces, and more.
cAdvisor logo
cAdvisor gives container users insight into the resource use and performance of their running containers and is generally used with Prometheus as well as other third-party tools, like Grafana and Graphite.
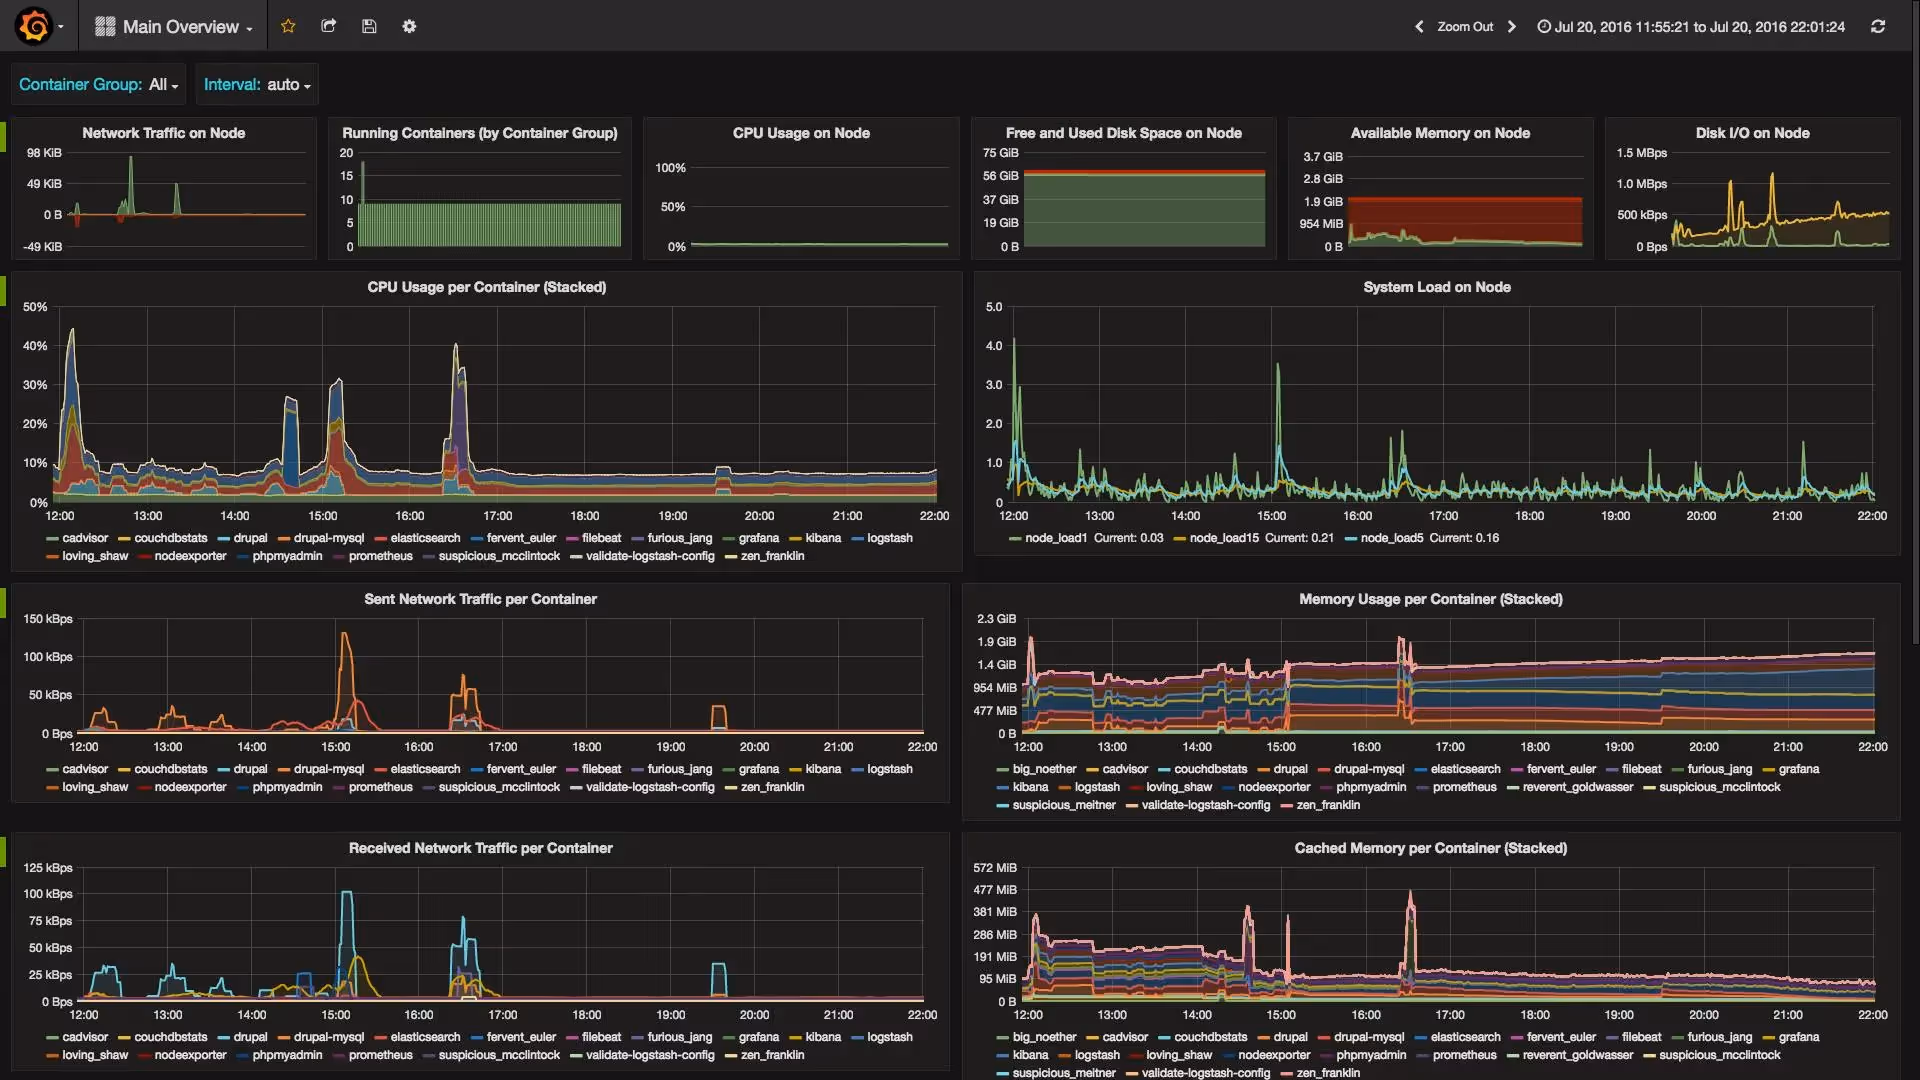
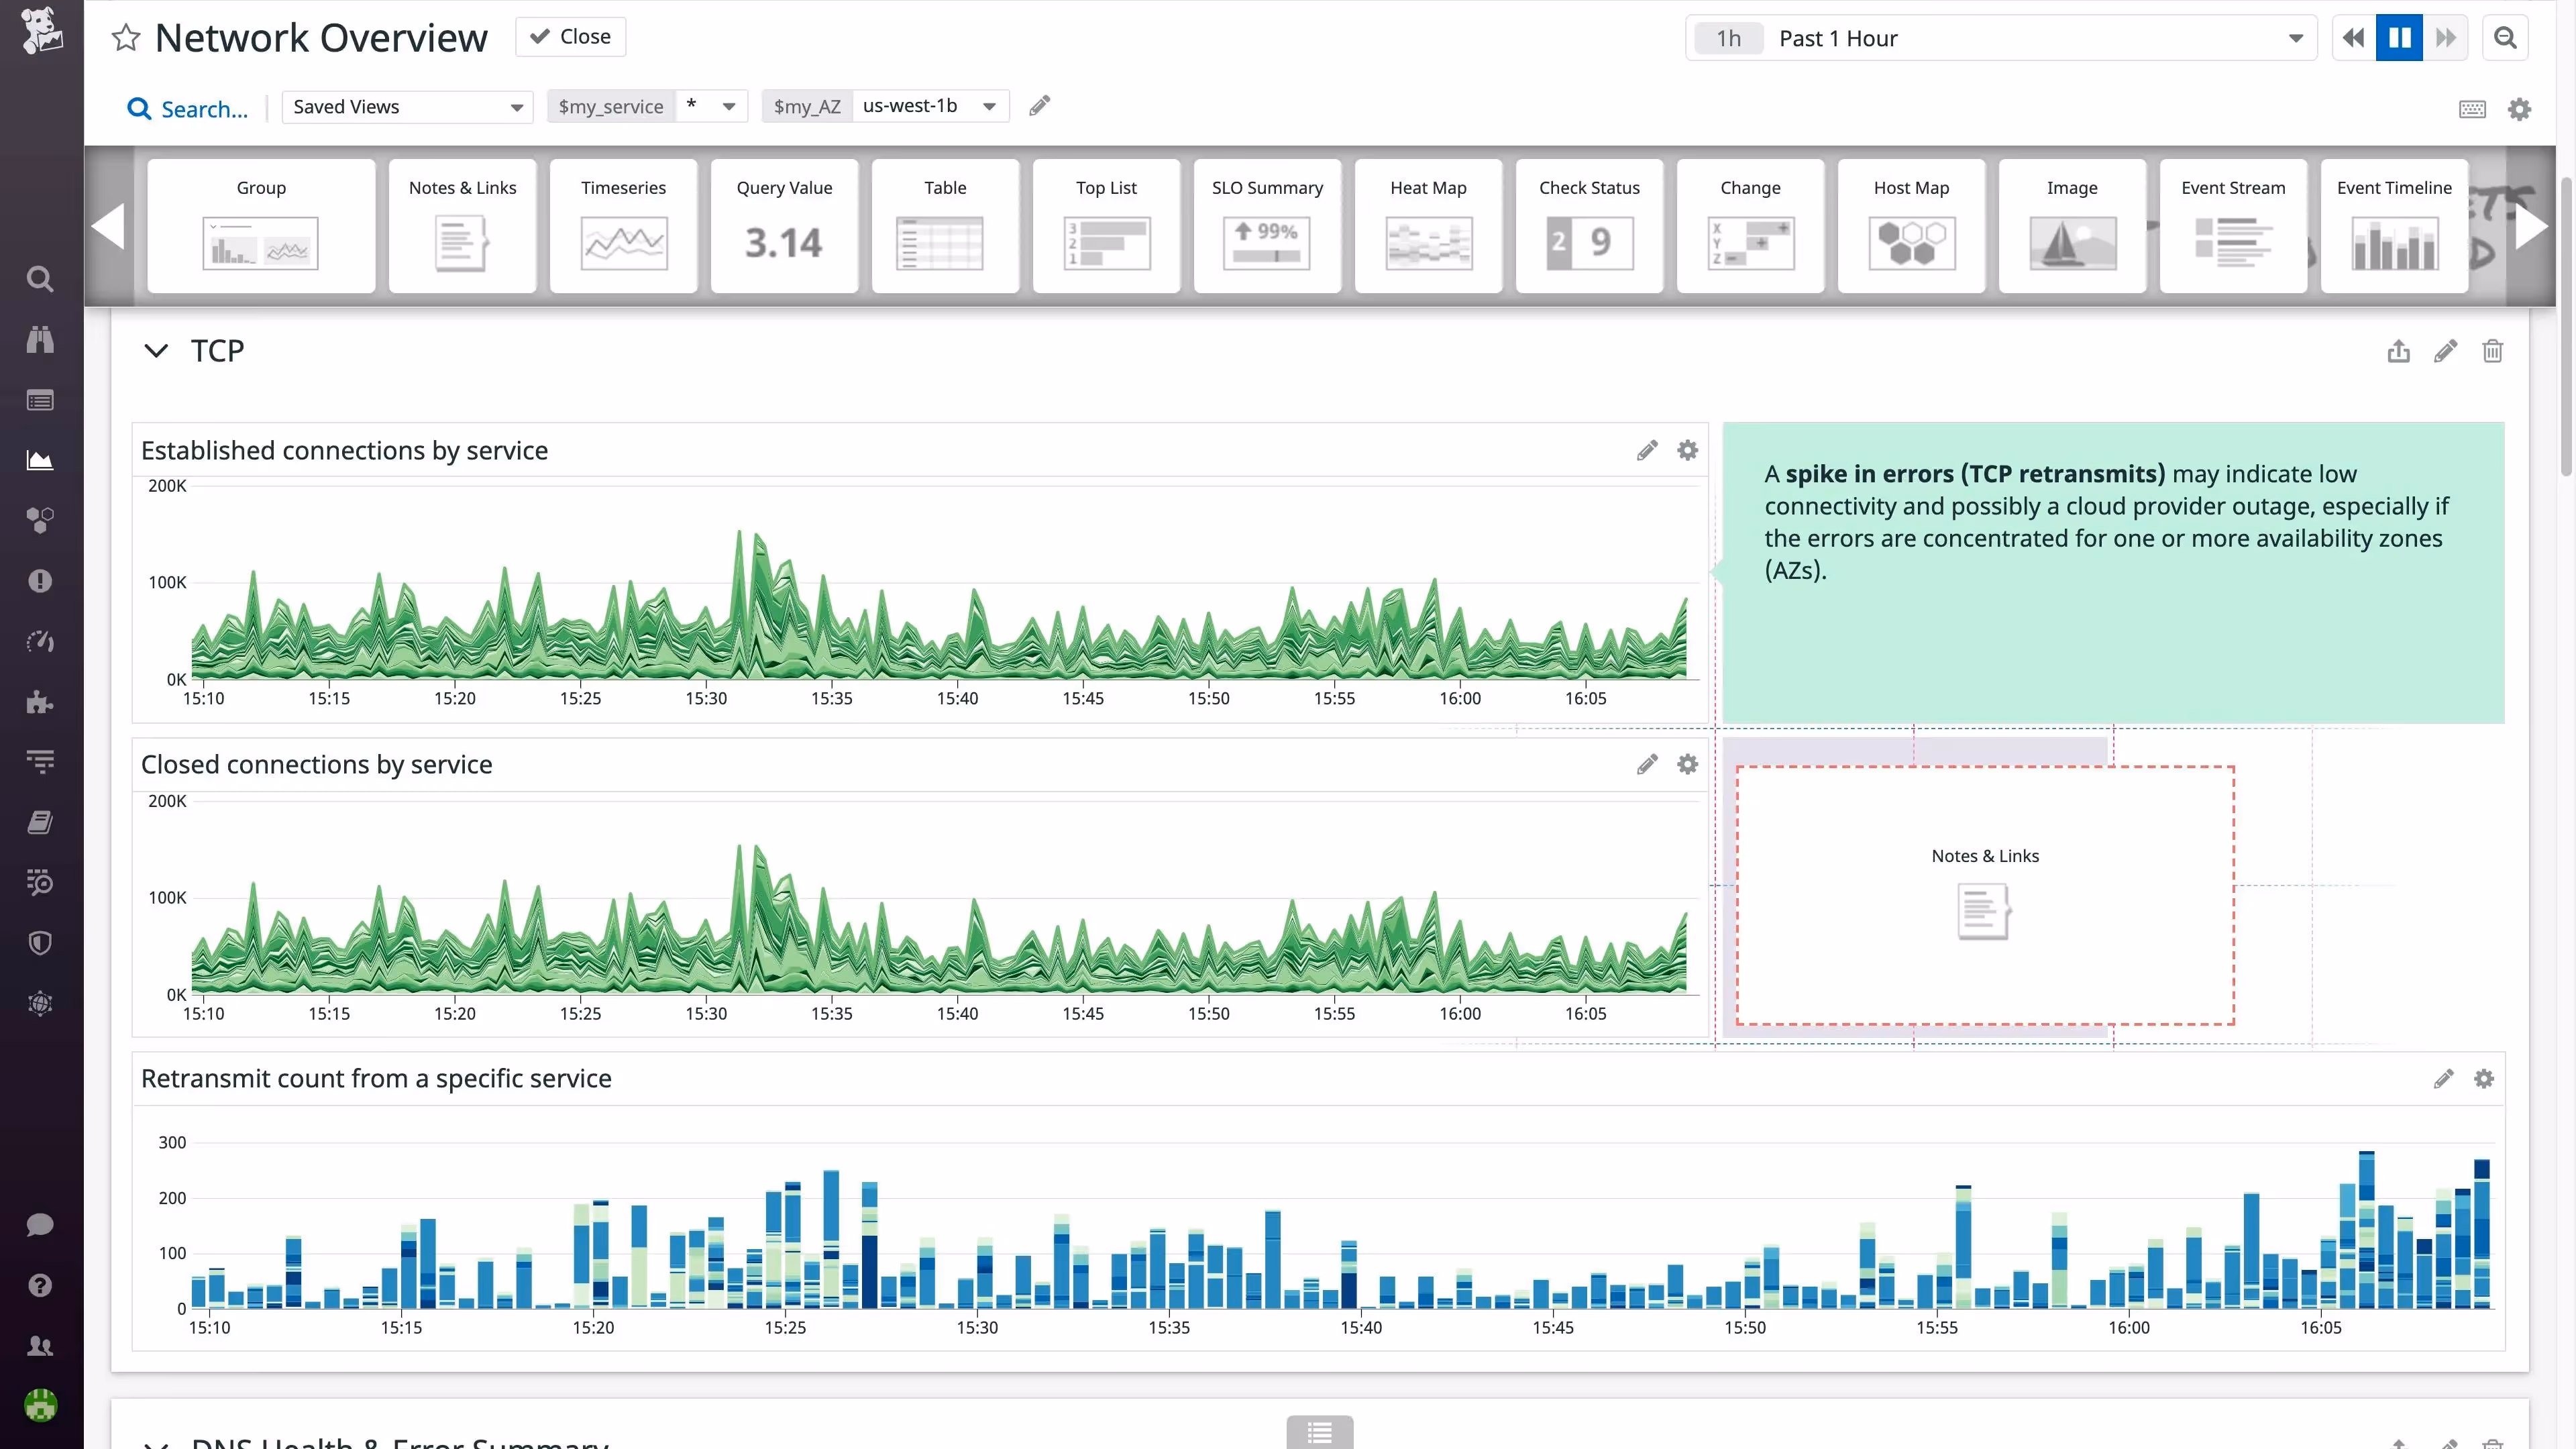
4. Grafana
Grafana is an open-source container monitoring tool that comes with out-of-the-box monitoring, logging, and alerting suite for Docker hosts and containers. We selected Grafana as it permits the ability to query Prometheus. Grafana’s Prometheus data source has been added since Grafana 2.5.0.
Grafana allows you to create, study, and share all your data through visually appealing dashboards that, unlike other technologies, you can specifically tailor for your team.
Grafana dashboard
Grafana is flexible and versatile in the sense that it allows any data to be translated and transformed into flexible and dynamic dashboards. This provides not only analytical meaning to data gathered from many sources but also the ability to be shared with other team members, allowing you to examine the data together.
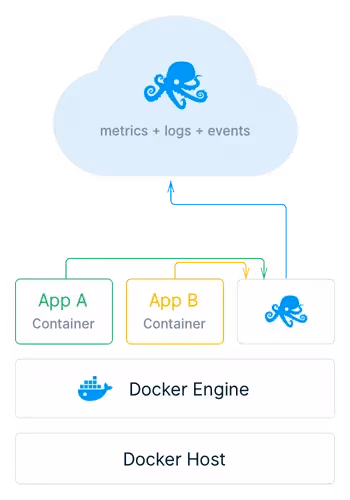
5. Sysdig
Finally, Sysdig is an open-source container monitoring tool that employs transparent instrumentation to look inside Docker containers from the outside, eliminating the requirement for agents or scripts in each container. We have selected Sysdig because it makes Docker monitoring and security easier by using this information from your orchestration tools.
Sysdig dashboard
Sysdig delivers more relevant monitoring dashboards by giving real-time data from Docker containers and the apps within them. Security warnings and troubleshooting are also available across all microservices.
Sysdig auto discovers containers and gathers metrics and events from every tier of the stack in real-time. With a single agent per host, Sysdig can provide excellent insight into your containers.
Agents ship fast. Guardrails keep them safe.
Qovery ensures every agent action is scoped, audited, and policy-checked. Start deploying in under 10 minutes.
Proprietary software is advantageous compared to open-source tools in terms of reliability and warranty from creators. Often, proprietary tools are easier to use. Here are a few paid solutions to consider for Docker monitoring.
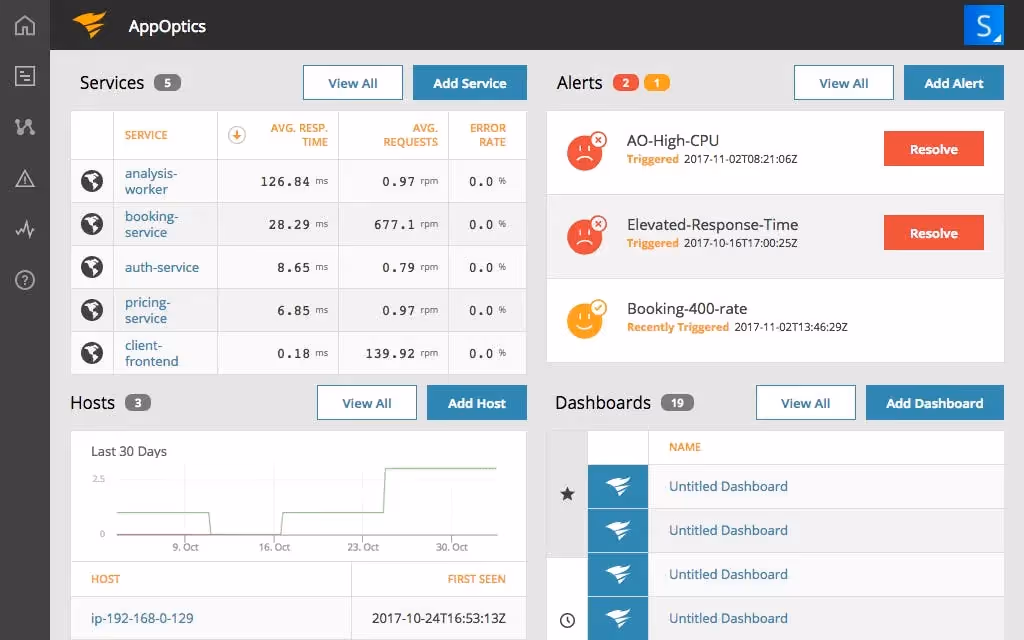
6. AppOptics
AppOptics is an excellent tool to monitor Docker container applications. To deliver the performance insights you need, you can get an AppOptics Docker integration with efficient data uses, including CPU utilization, right out of the box.
We chose AppOptics because it allows you to quickly and easily set up alerts to be sent out automatically when certain Docker metrics surpass specified thresholds.
AppOptics dashboard
When thresholds are surpassed, the need for warnings should not always lead to a never-ending barrage of notifications. AppOptics allows you to set and receive meaningful alerts while also reducing false positives.
7. Sematext
Sematext is a proprietary tool from a worldwide company that develops cloud and on-premises technologies for monitoring, alerting, and anomaly detection in applications.
The Sematext Agent, a component of Sematext, captures all host and container metrics and runs as a tiny container. You can use docker-compose or a simple docker run command to launch it.
We selected Sematext because it’s a DaemonSet that operates on Kubernetes, but it can also run as a Docker Swarm service.
Sematext chart with Docker containers
Sematext Agent is a lightweight and native application. On each of your Docker hosts, it operates as a minimal container. It comes with out-of-the-box Docker monitoring dashboards that include a CPU, memory, network problems, disc IO, and much more.
Sematext tracks host and container metrics as well as events. It supports Docker monitoring and alerting with prebuilt Docker monitoring dashboards and container alert rules.
8. Datadog
Datadog allows you to monitor your containers in the context of your whole infrastructure and smoothly expands with your deployments, ensuring that you don’t miss anything.
We like Datadog as running the Datadog Agent on the host, where it can access container information, is the easiest approach to monitor Docker containers. This process is seamless if you’re installing Docker alongside existing applications, like databases on full-fledged host OSs.
Datadog dashboard
As Docker runs containers using existing kernel structures, such as cgroups and namespaces, the Datadog Agent, a component of Datadog, leverages native cgroup accounting metrics to collect memory, network, CPU, and other metrics of the containers. These metrics are collected every fifteen seconds before forwarding them to Datadog.
9. SolarWinds
SolarWinds is a server and application monitoring tool that allows users to automatically see, measure, and correlate important performance data for individual Docker containers, such as CPU, memory, and uptime.
We chose SolarWinds as it provides complete virtualization performance management, as well as powerful capacity planning tools, VM sprawl control, predictive suggestions, and management across on-premises, hybrid, and cloud environments.
SolarWinds dashboard
SolarWinds’s ability to identify faults straight from the container layer is one of its differentiating characteristics, giving it an advantage over other traditional server monitors.
Conclusion
Dockerized apps running within containers, with resources dynamically allocated, are at the heart of monitoring challenges. As container images get more intricate as patches and updates become more common, it’s critical to use Docker monitoring solutions that are both reliable and fast to deploy across thousands of nodes.
Platforms like Prometheus, Datadog, and SolarWinds offer robust, specialized solutions. However, if you are looking for a platform that integrates application deployment with a comprehensive and developer-friendly observability stack, Qovery stands out.
Its unified approach allows you to deploy and monitor your Docker applications on your own cloud with unparalleled simplicity, making it a powerful choice for teams that want to streamline their entire DevOps workflow.
Romaric founded Qovery to make Kubernetes accessible to every engineering team. He writes about platform strategy, developer experience, and the future of cloud infrastructure.
Next step
Agents ship fast. Guardrails keep them safe.
Qovery ensures every agent action is scoped, audited, and policy-checked. Start deploying in under 10 minutes.