Service Deployment Issues
Find solutions for the most common deployment errors and issues you may encounter when deploying services on Qovery.Connection Refused Error
Connection Refused Error
- Port mismatch - The port in your Qovery configuration doesn’t match the port your application listens on
- Localhost binding - Your application listens on
localhost(127.0.0.1) instead of all interfaces (0.0.0.0)
Verify Port Configuration
- If your app listens on port 8080, configure port 8080 in Qovery
- Check your application logs to see which port it’s actually using
Not Enough Resources
Not Enough Resources
- Reduce Service Resources
- Upgrade Instance Type
- Increase Node Count
- Go to your service Settings → Resources
- Reduce CPU or Memory requests
- Redeploy the service
Application is Crashing
Application is Crashing
Access the Container
Investigate the Issue
- Check environment variables:
env - Test your startup command manually
- Review application configuration files
- Check for missing dependencies
For Rapidly Crashing Apps
- Remove the port temporarily from service settings (this prevents Kubernetes from restarting it)
- Modify your Dockerfile to use a sleep command:
- Deploy with this change
- Use
qovery shellto debug - Fix the issue and restore the original entrypoint
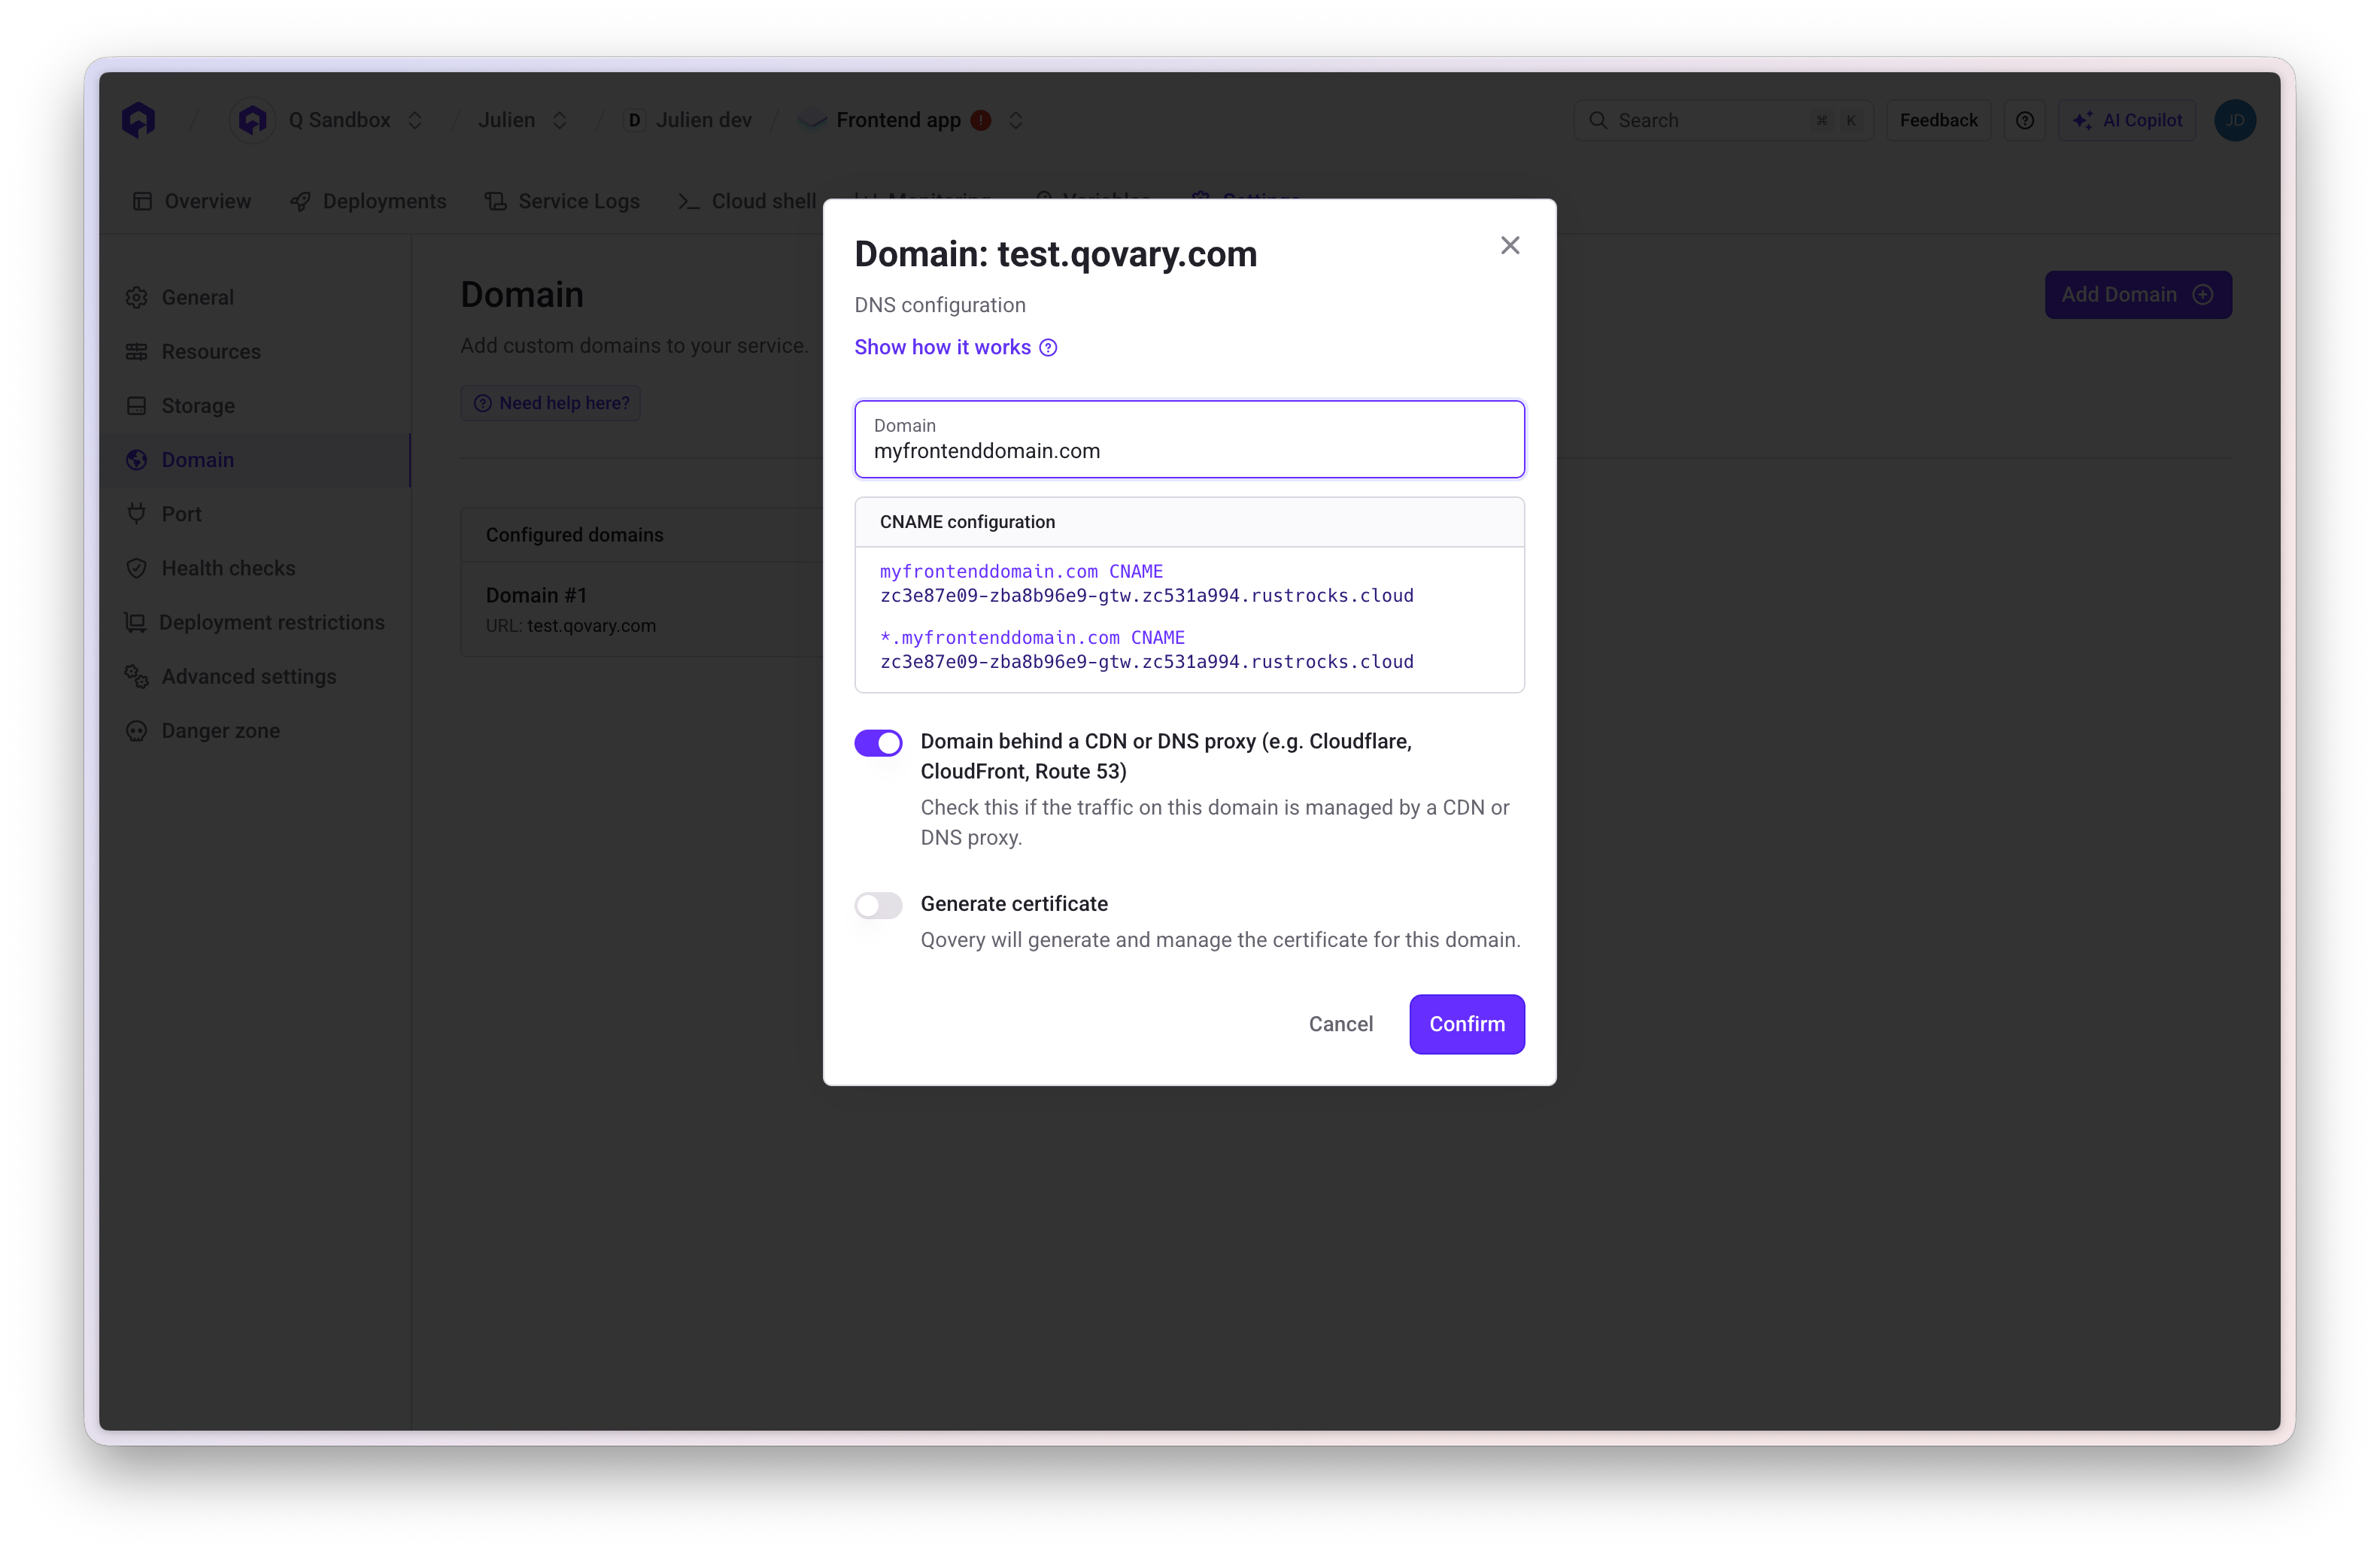
SSL/TLS Certificate Issues
SSL/TLS Certificate Issues
Identify the Problem
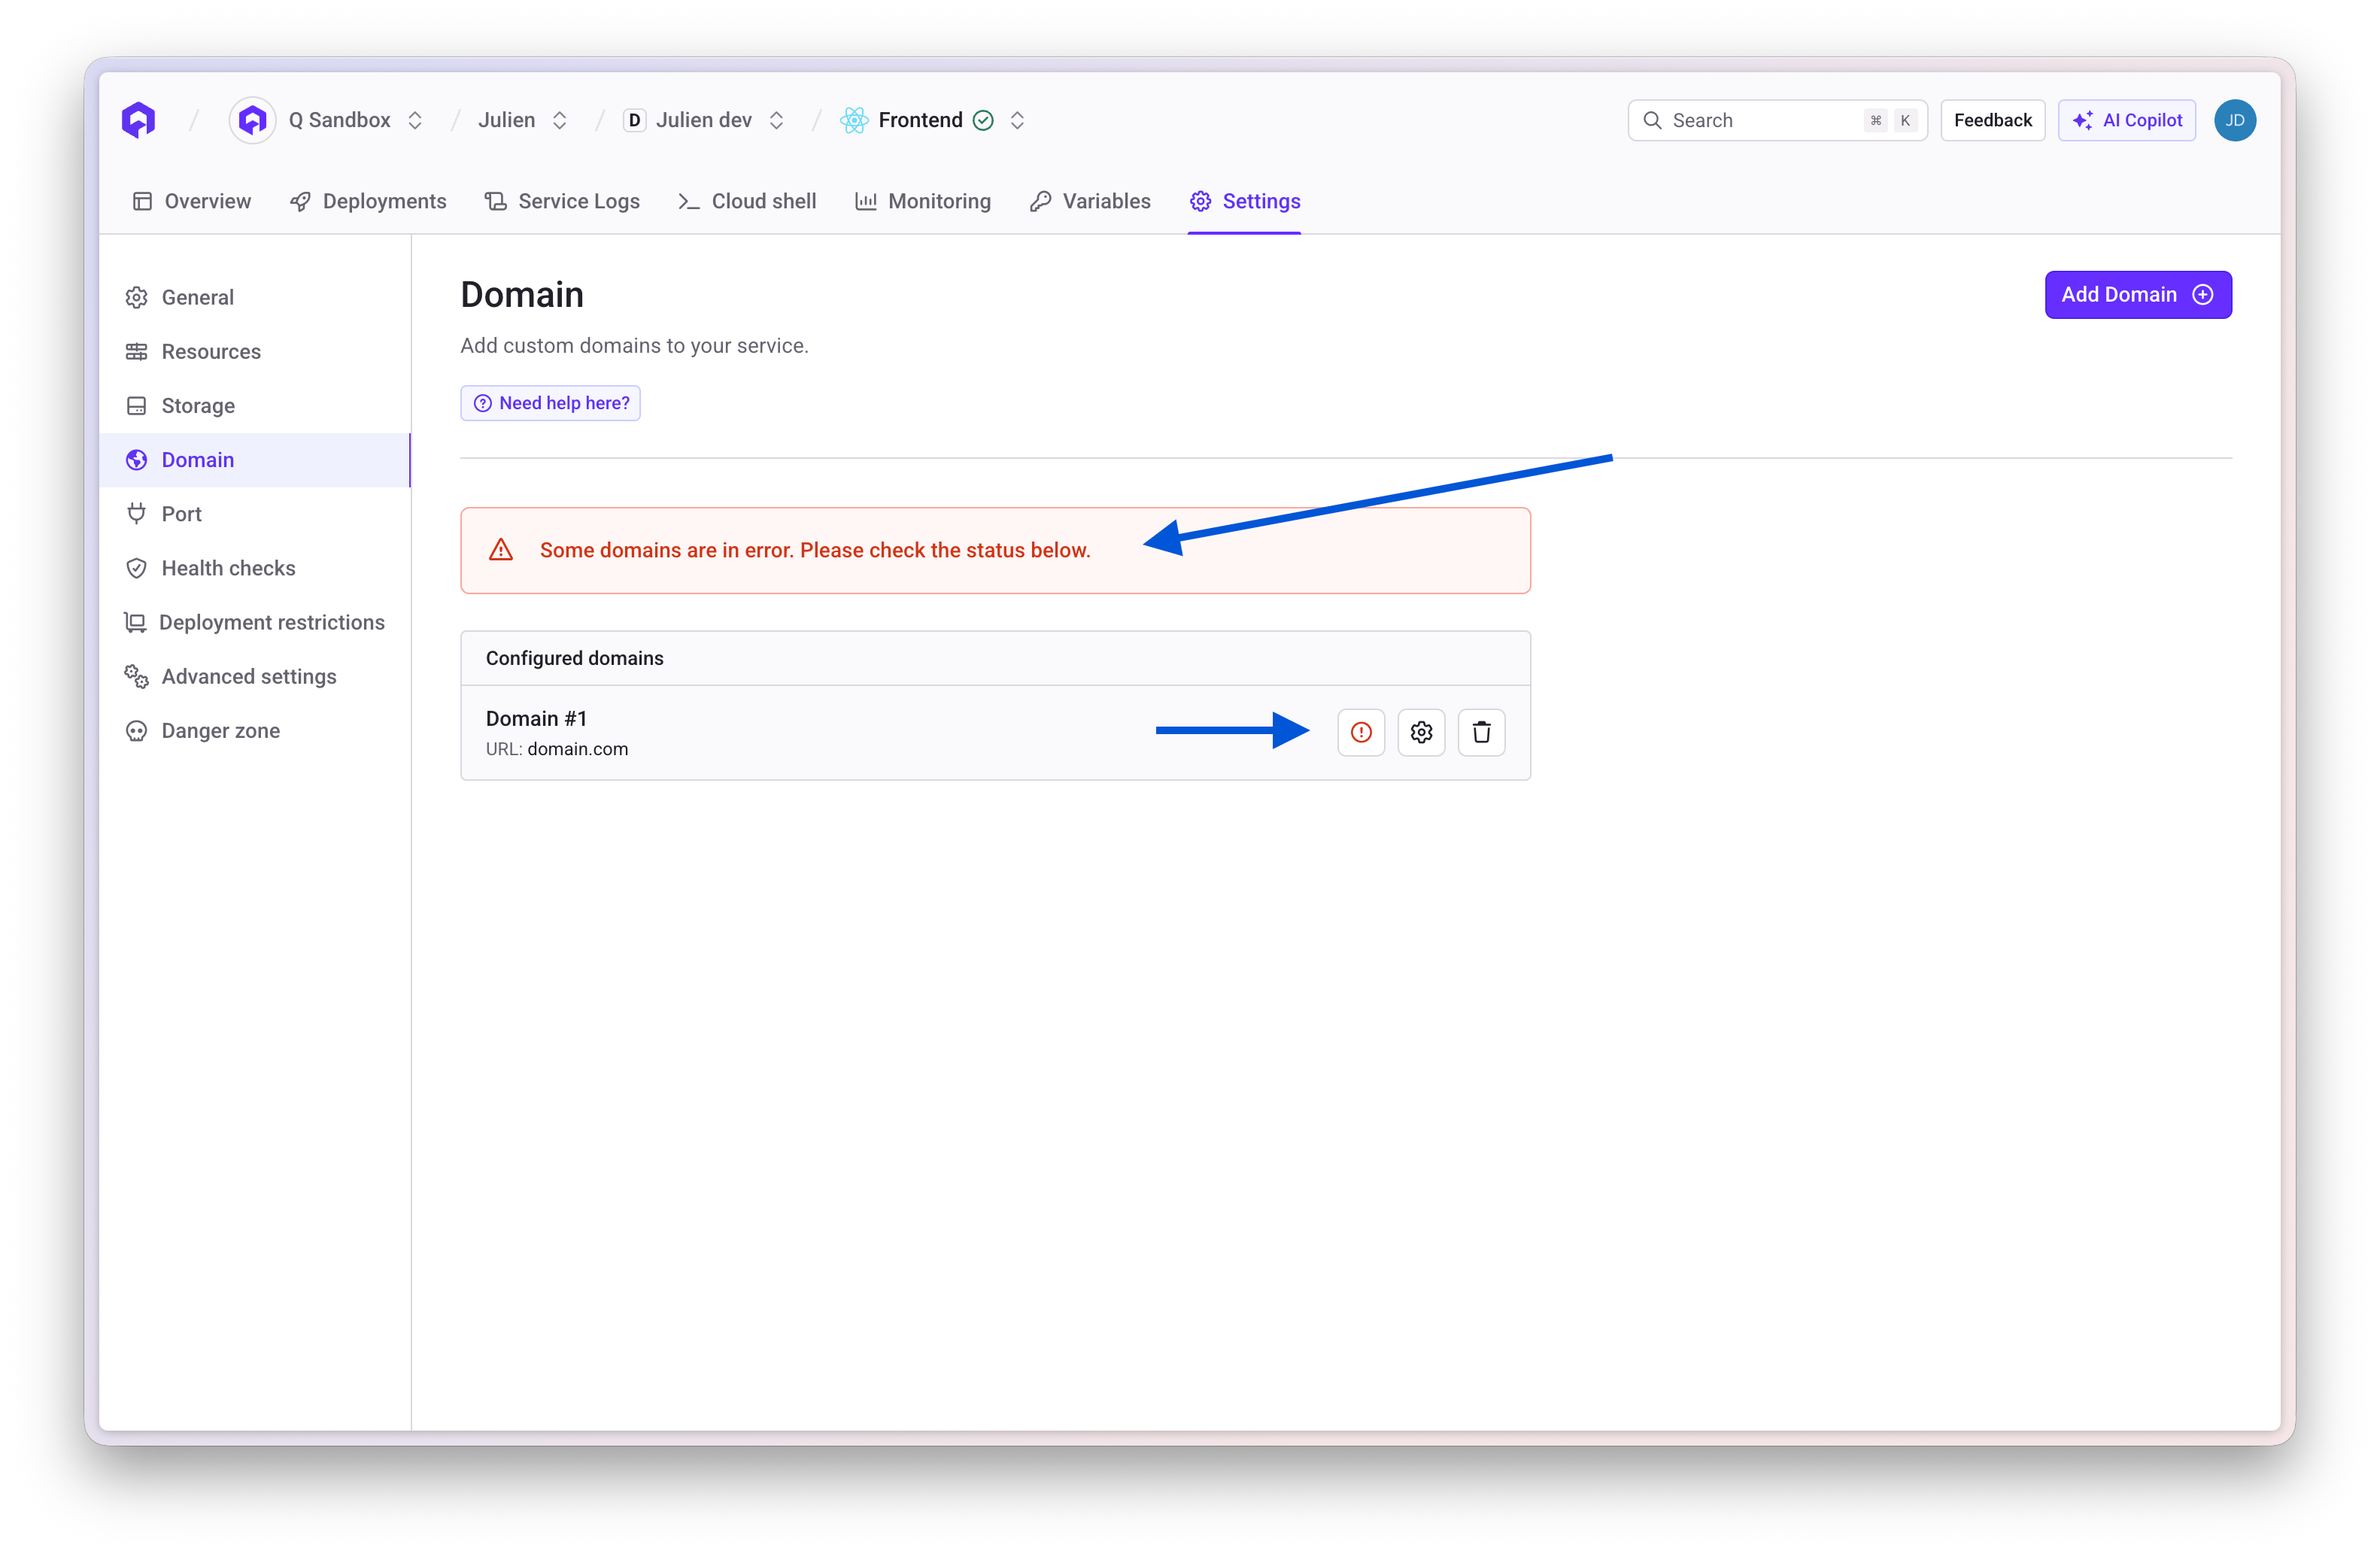
Verify DNS Configuration
Docker Build Timeout
Docker Build Timeout
Increase Build Timeout
- Go to your service Settings → Advanced Settings
- Find the build.timeout_max_sec parameter
- Increase the value (e.g.,
3600for 1 hour) - Save and redeploy
Git Submodule Errors
Git Submodule Errors
- Make Submodule Public (Recommended)
- Use Git Credential Helper
- Use SSH Keys
Lifecycle Jobs & Cronjobs Execution Failed
Lifecycle Jobs & Cronjobs Execution Failed
- Code exceptions - Errors in your application code
- Out of memory - Job exceeds memory limits
- Execution timeout - Job takes longer than configured maximum duration
Check Job Logs
- Go to your Job service
- Click Logs tab
- Look for error messages or stack traces
- Identify the root cause (exception, OOM, timeout)
SnapshotQuotaExceeded Error (Database)
SnapshotQuotaExceeded Error (Database)
SnapshotQuotaExceeded error.Cause: Qovery automatically creates a snapshot before deleting a database. If you’ve reached your cloud provider’s snapshot quota, this fails.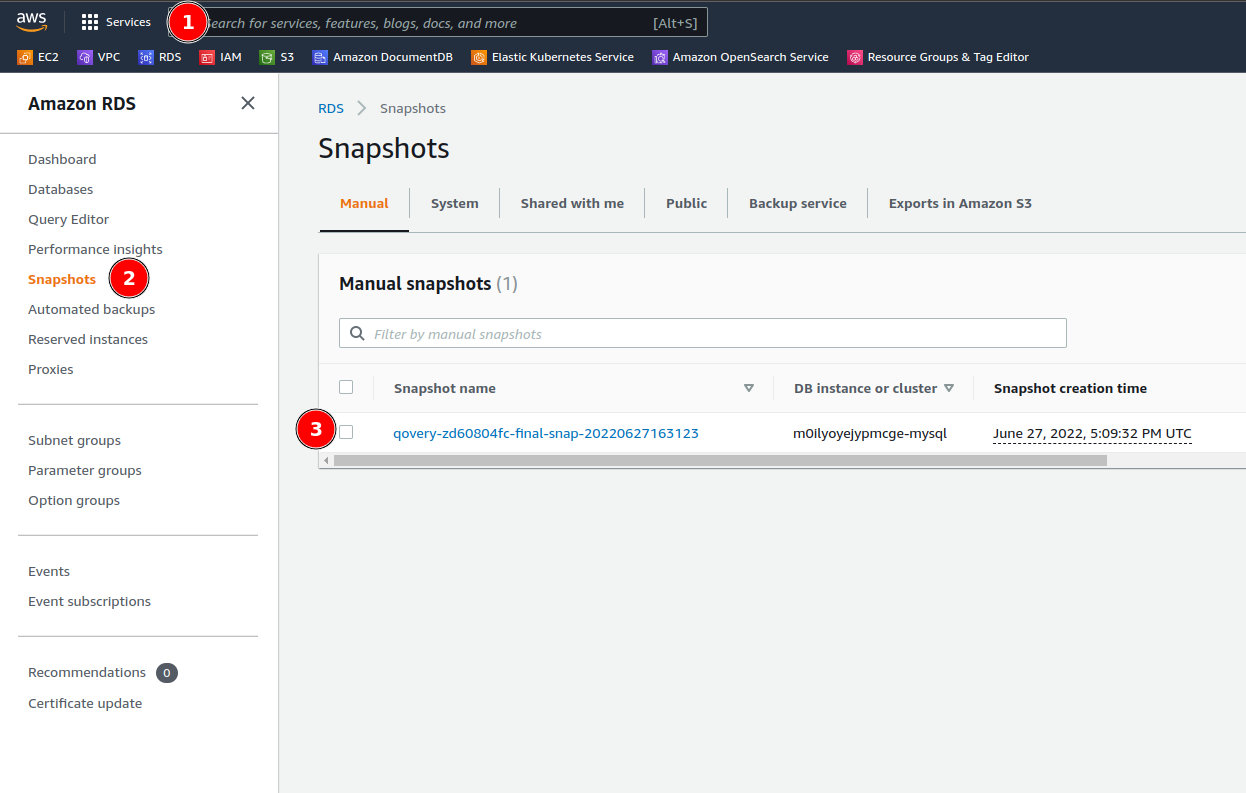
- Delete Old Snapshots
- Request Quota Increase
- Go to AWS RDS Console
- Navigate to Snapshots
- Delete old snapshots you no longer need
- Retry database deletion in Qovery
Service Runtime Issues
Find solutions for common runtime errors and issues you may encounter when operating services on Qovery after successful deployment.SIGKILL Signal 137 - Memory Exhaustion
SIGKILL Signal 137 - Memory Exhaustion
Increase Memory Allocation
- Go to your service Settings → Resources
- Increase the Memory limit
- Start with a 50% increase (e.g., 512MB → 768MB)
- Redeploy and monitor
Investigate Memory Leaks
- Memory usage steadily increases over time
- Container was fine, then started crashing after recent code changes
- Memory never levels off or decreases
- New dependencies or library updates
- Code changes in recent deployments
- New features that load data into memory
- Caching implementations without expiration
Optimize Memory Usage
- Clear unused variables and objects
- Implement pagination for large datasets
- Use streaming for file processing
- Add proper cache eviction policies
- Profile your application to find memory-intensive code
Debugging Rapidly Crashing Applications
Debugging Rapidly Crashing Applications
qovery shell to investigate.Solution:Temporarily Remove Application Port
- Go to your service Settings → Ports
- Remove or disable the application port
- Deploy the changes
Modify Dockerfile to Keep Container Running
Access the Container
Debug Manually

Helm Service Logging Limitations
Helm Service Logging Limitations
Add Labels and Annotations
deployment.yaml, service.yaml, or job.yaml to include Qovery macros:Required Resources
- Deployments - For long-running applications
- StatefulSets - For stateful applications
- Jobs - For one-time tasks
- CronJobs - For scheduled tasks
- Services - For networking
- Pods - If you create standalone pods
High CPU Usage
High CPU Usage
- Application becomes slow or unresponsive
- CPU throttling warnings in logs
- Pods getting OOMKilled even with sufficient memory
- Check CPU metrics in Qovery Console
- Review recent code changes that might be CPU-intensive
- Look for infinite loops or inefficient algorithms
- Check for CPU-intensive operations running on every request
- Optimize hot paths in your code
- Implement caching for expensive operations
- Move heavy processing to background jobs
- Increase CPU allocation if legitimately needed
- Use profiling tools to identify bottlenecks
Slow Application Response
Slow Application Response
- Database connection issues
- External API timeouts
- Insufficient resources
- Inefficient code paths
- Network latency
- Check application logs for slow queries or timeouts
- Review database connection pools
- Monitor external API response times
- Profile your application to find slow endpoints
- Check network policies that might be blocking traffic
Cluster Issues
Find solutions for common errors you might encounter while deploying or updating Qovery clusters.DependencyViolation Errors During Cluster Deletion
DependencyViolation Errors During Cluster Deletion
DependencyViolation error.Cause: Resources managed outside of Qovery remain attached to cluster infrastructure elements, preventing deletion.Example Error:Navigate to VPC Section
- Go to VPC Console
- Find the VPC associated with your Qovery cluster
- Look for the subnet mentioned in the error message
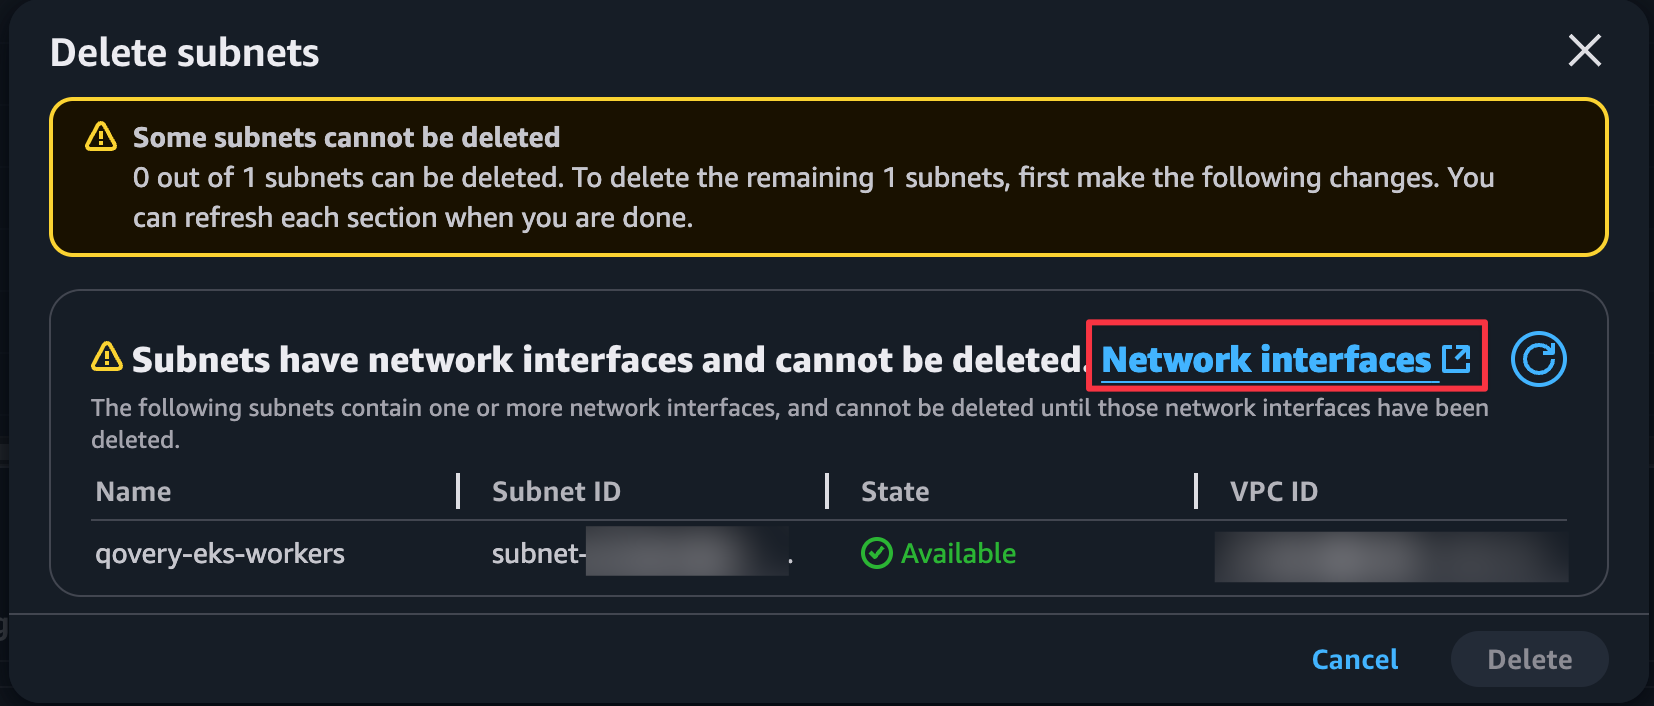
Attempt to Delete the Resource
- Select the resource
- Click Delete or Actions → Delete
- The cloud provider will show what’s blocking the deletion
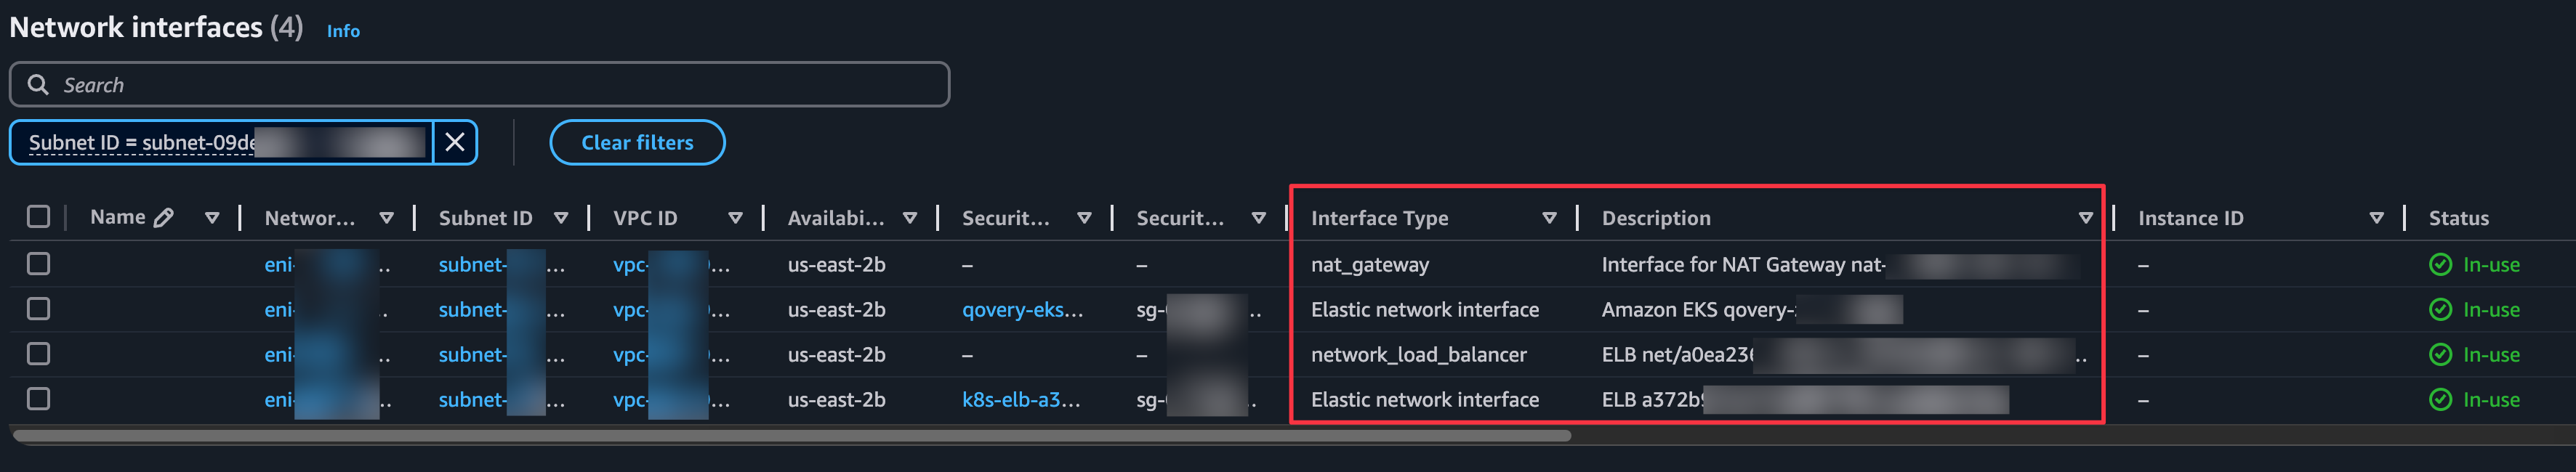
Identify Blocking Resources
- Network Interfaces - Check the Type and Description fields
- NAT Gateways - May be attached to subnets
- Load Balancers - Can block subnet deletion
- EC2 Instances - Running or stopped instances
- Lambda Functions - With VPC configuration
- RDS Instances - In the VPC
Delete Blocking Resources
- Note down which resources are blocking
- Delete them from the cloud console
- Wait for deletion to complete
Removing Qovery Resources Without Platform Access
Removing Qovery Resources Without Platform Access
Method A: AWS Resource Groups & Tag Editor
Access Resource Groups
- Log into AWS Console
- Go to Resource Groups & Tag Editor service
- Click Create Resource Group
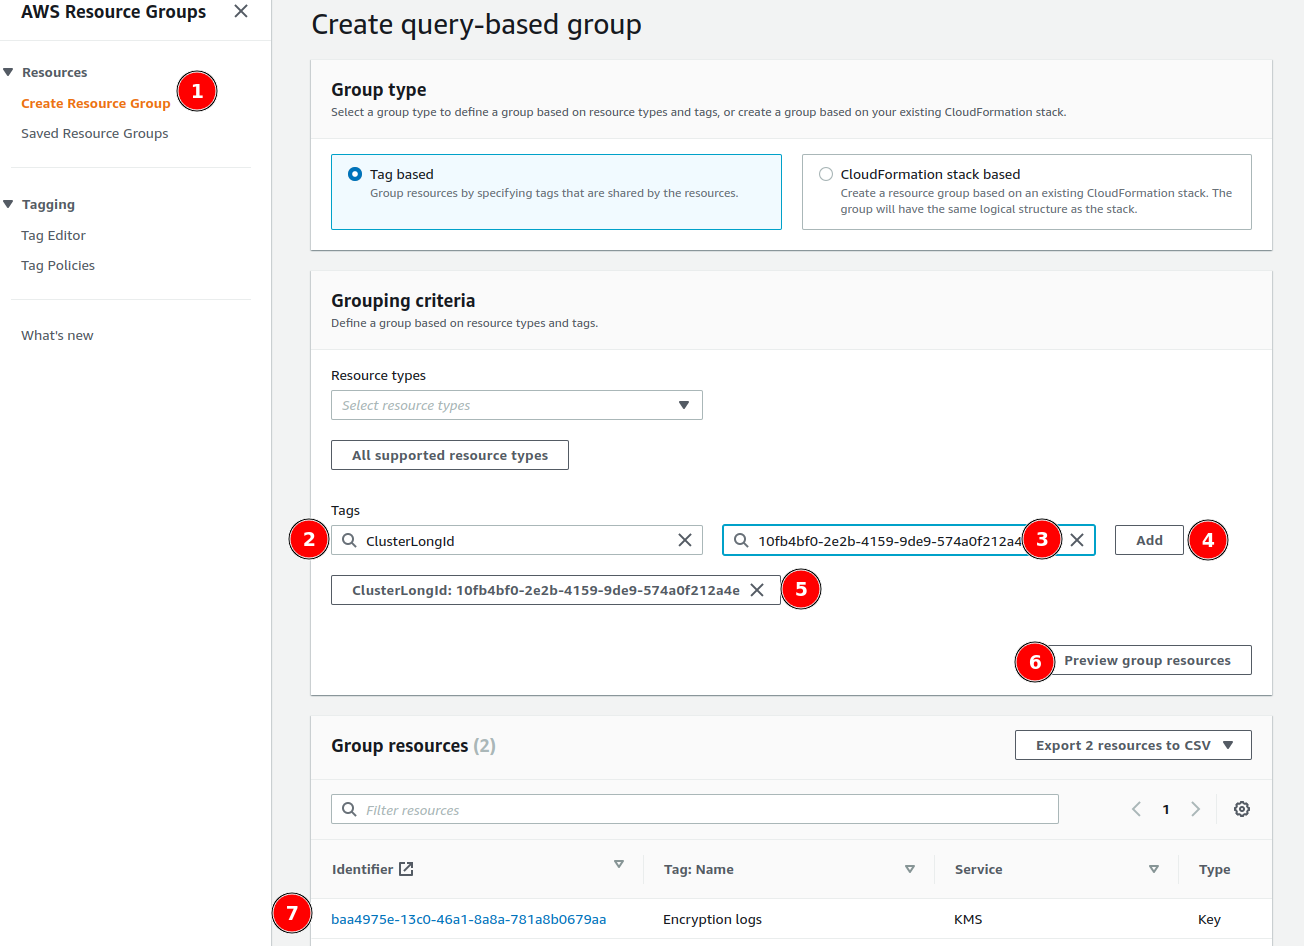
Filter by Qovery Cluster Tag
- Choose Tag based group type
- Add tag filter:
- Tag key:
ClusterLongId - Tag value: Your Qovery cluster ID (found in cluster settings or URL)
- Tag key:
- Click Preview group resources
Method B: AWS CLI Script
Use this bash script to list all resources in a VPC by ID:Blocked Cloud Account
Blocked Cloud Account
-
Billing Issues
- Outstanding payment
- Credit card expired
- Payment method declined
-
Free Tier Restrictions
- Attempting to deploy in regions not supported by free tier
- Exceeding free tier limits
-
Account Compliance Violations
- Terms of service violations
- Abuse reports
- Security issues
Contact Your Cloud Provider
- AWS: Contact AWS Support
- GCP: Contact Google Cloud Support
- Azure: Open Azure Support Ticket
- Scaleway: Open Support Ticket
Verify Billing
- Check your billing dashboard
- Ensure payment method is valid
- Resolve any outstanding payments
Check Account Status
- Active incidents
- Service health issues
- Account restrictions

Missing SQS Permissions with Karpenter (AWS)
Missing SQS Permissions with Karpenter (AWS)
Verify IAM Policy
- Check the official Qovery IAM policy
- Compare with your current IAM user/role permissions
- Ensure all SQS permissions are included:
Check AWS Organization SCPs
- Go to AWS Policy Simulator
- Select your IAM user or role
- Choose SQS service
- Test these actions:
CreateQueueDeleteQueueGetQueueAttributesSetQueueAttributesTagQueue
- For resource, use:
arn:aws:sqs:::qovery*
Interpret Results
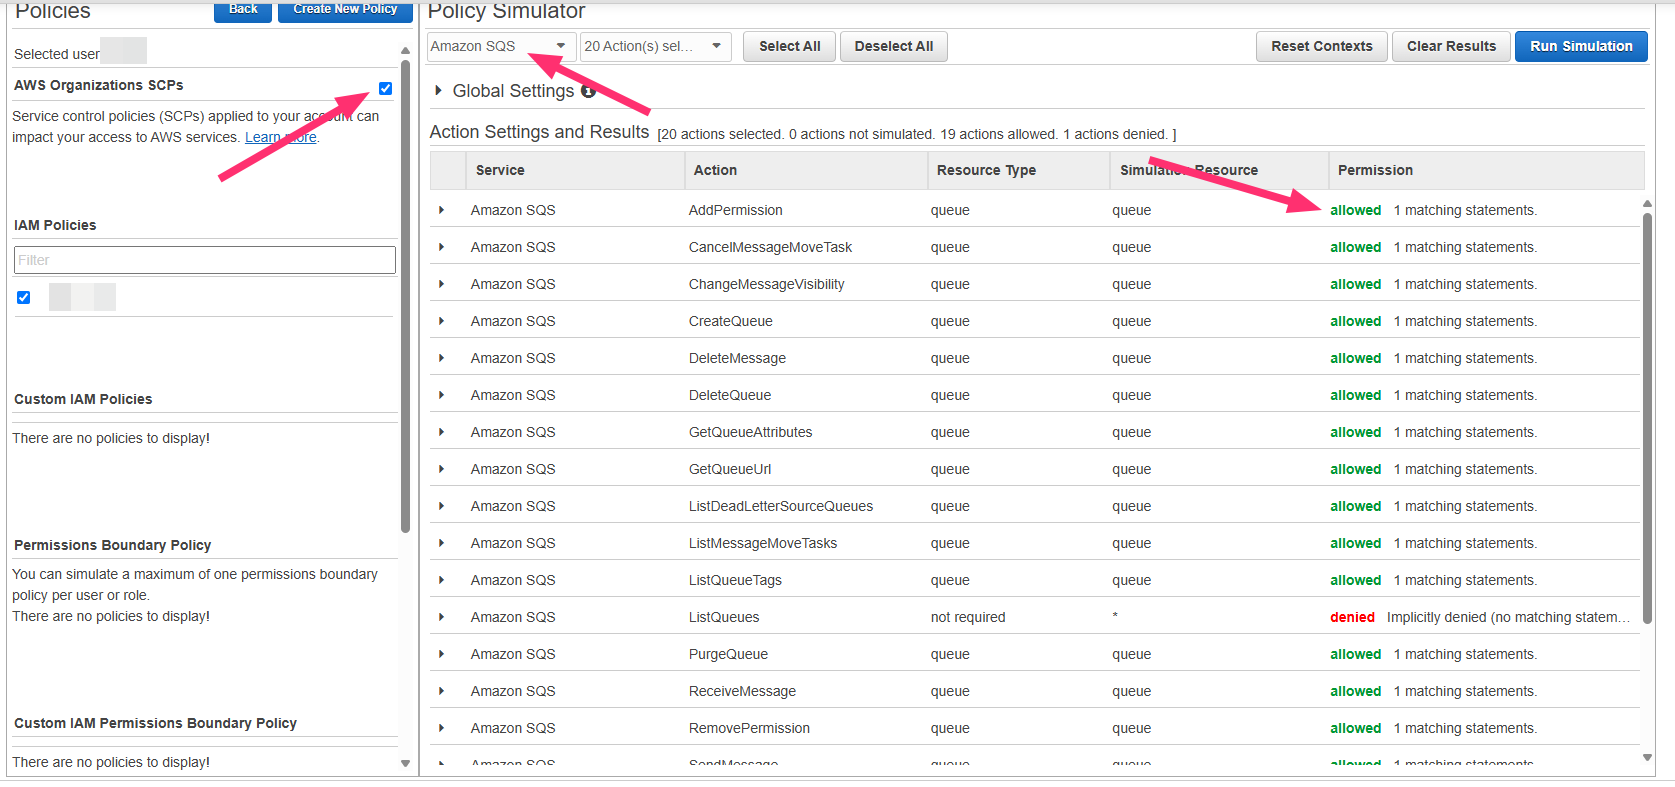
- Contact Qovery Support
- Provide cluster ID and error logs
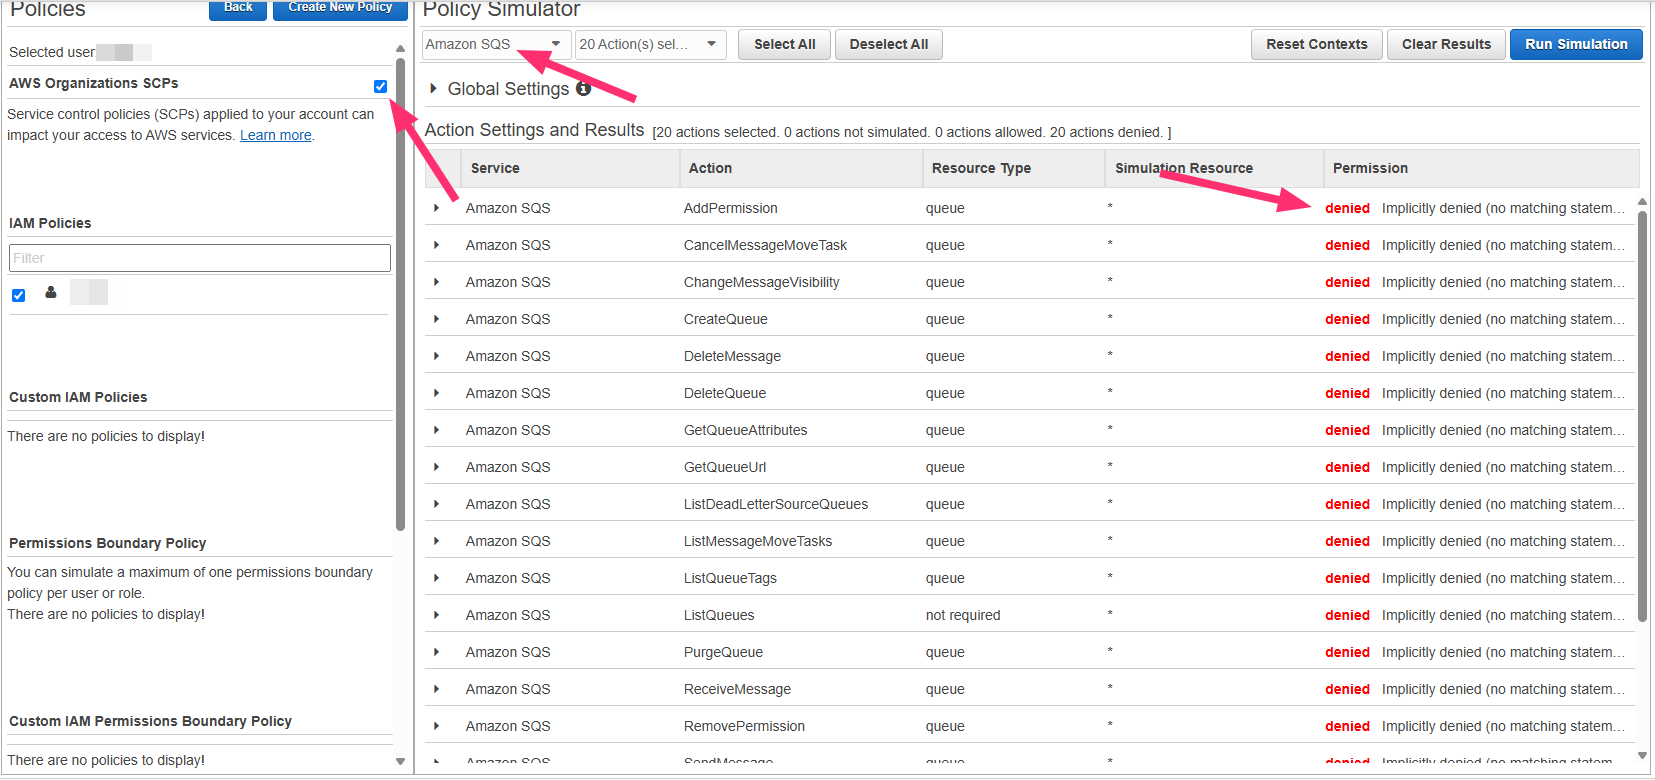
- SCP is blocking Qovery access
- Contact your AWS administrator
- Request SQS permissions for Qovery resources
Update IAM Policy
- Go to IAM Console
- Find your Qovery IAM user
- Update attached policies to include SQS permissions
- Retry cluster creation
- Update the CloudFormation stack
- Add missing SQS permissions to the role
- Wait for stack update to complete
- Retry cluster creation
Cluster Stuck in 'Deploying' State
Cluster Stuck in 'Deploying' State
- Cluster shows “Deploying” for more than 45 minutes
- No progress in deployment logs
- AWS service quotas exceeded
- Region capacity issues
- Network connectivity problems
- Invalid cluster configuration
-
Check Cluster Logs:
- Go to Cluster Settings → Logs
- Look for specific error messages
-
Verify Service Quotas:
- Check AWS Service Quotas for EC2, VPC, ELB
- Request increases if needed
-
Try Different Region:
- Some regions may have capacity issues
- Try deploying to an alternative region
-
Contact Support:
- If issue persists > 1 hour, contact support
- Provide cluster ID and deployment logs
Need More Help?
If you don’t find what you need in this troubleshooting guide, we’re here to help:Help & Support
Documentation
Changelog
Quick Links
- Service Logs - Learn how to access and analyze service logs
- Deployment Statuses - Understand deployment status indicators
- Cluster Configuration - Configure your cluster settings
- Advanced Settings - Fine-tune service configurations