Blog
Product
Observability
minutes

RDS monitoring is now available in Qovery Observe

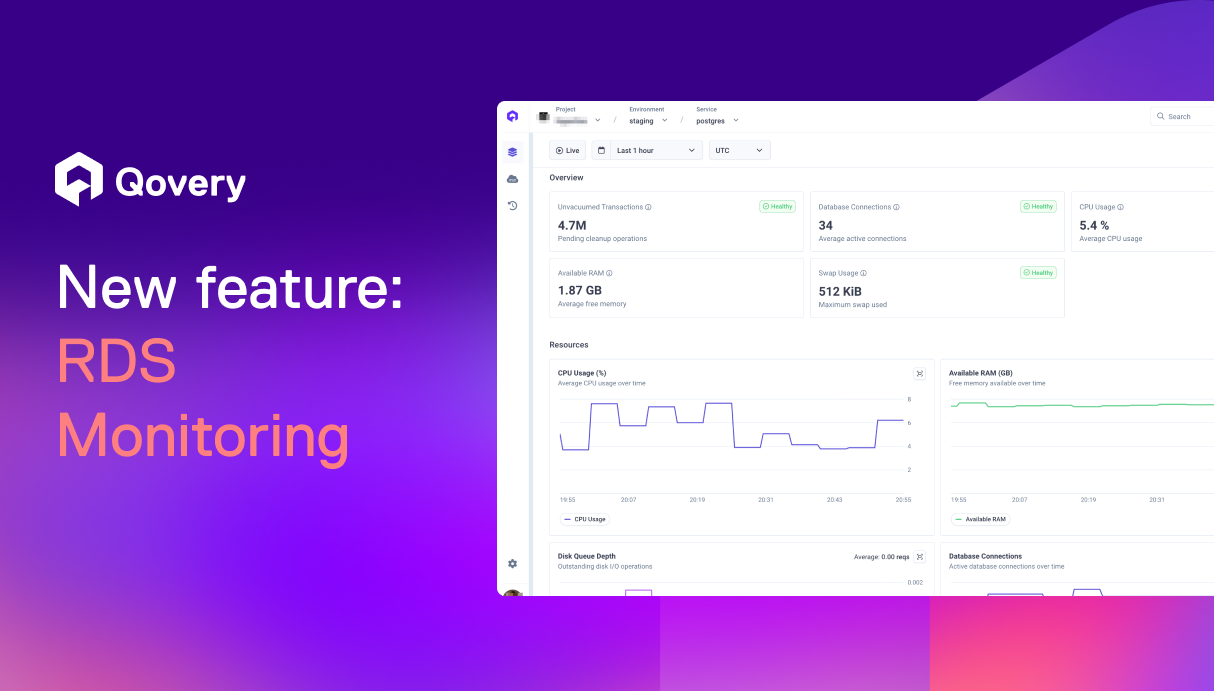
Starting today, get full visibility on your RDS databases directly inside Qovery. Troubleshoot app and database issues from one place without jumping into the AWS console
November 20, 2025
Alessandro Carrano
Head of Product
Summary
Twitter icon
linkedin icon

The real problem behind incident resolution - Databases

When an incident hits, teams often struggle to understand if the root cause is coming from the application or the database. Developers and DevOps jump between different tools, dig through the AWS console, try to find the right CloudWatch view, and manually correlate timestamps between their app logs and RDS metrics. This slows down diagnosis at the exact moment when time matters most.

When Qovery Observe kicks in

Qovery centralizes observability together with deployment and provisioning, creating a unique experience for developers.

Because Qovery already helps teams deploy and manage RDS instances with almost no friction, adding direct RDS monitoring inside the platform was the natural next step.

By exposing technical metrics like CPU, memory, and disk usage directly inside Qovery, teams can troubleshoot Kubernetes workloads and their RDS databases in one place, without jumping back and forth between consoles.

Outcomes for your team

  • Clearer visibility: your team gets immediate access to the right RDS metrics without navigating the AWS console, so you always know how your database behaves during incidents and peak traffic
  • Faster troubleshooting: no more guessing if the bottleneck sits in the app or the database. You can spot CPU spikes, memory pressure, or storage saturation in seconds and act right away
  • Less context switching: everything lives where your deployments, logs, and events already are. This removes the cognitive overhead of juggling multiple tools during stressful debugging sessions
  • Easier understanding of complex metrics: technical data like IOPS or disk throughput becomes easier to interpret when displayed next to your application activity. It gives developers more confidence when investigating database issues

Use case

A team noticed that their staging API was slowing down, but they could not tell if the issue was coming from their service or the underlying RDS database. Before, they had to browse through the AWS console, locate the right CloudWatch charts, switch back to their application logs, and compare timestamps manually. With Qovery RDS monitoring, they spotted a CPU spike and an IOPS saturation on the database directly from the same place where they investigate their application. The issue was identified and fixed in minutes instead of hours.

How to use it

  1. Open your environment in Qovery and select the RDS database you want to inspect
  2. Switch to the Observability tab to view live and historical metrics
  3. Correlate DB anomalies with your environment events in seconds

Curious to see how it looks like? Check-out this video

Try it now

This feature is available for all customers who have Qovery Observe enabled. If it is not yet active for your organization, contact your CSM to have it enabled.

Share on :
Twitter icon
linkedin icon
Tired of fighting your Kubernetes platform?
Qovery provides a unified Kubernetes control plane for cluster provisioning, security, and deployments - giving you an enterprise-grade platform without the DIY overhead.
See it in action

Suggested articles

AI
Compliance
 minutes
Agentic AI infrastructure: moving beyond Copilots to autonomous operations

The shift from AI copilots to autonomous agents is redefining infrastructure requirements. Discover how to build secure, stateful, and compliant Agentic AI systems using Kubernetes, sandboxing, and observability while meeting EU AI Act standards

Mélanie Dallé
Senior Marketing Manager
Kubernetes
8
 minutes
The 2026 guide to Kubernetes management: master day-2 ops with agentic control

Effective Kubernetes management in 2026 demands a shift from manual cluster building to intent-based fleet orchestration. By implementing agentic automation on standard EKS, GKE, or AKS clusters, enterprises eliminate operational weight, prevent configuration drift, and proactively control cloud spend without vendor lock-in, enabling effective scaling across massive fleets.

Mélanie Dallé
Senior Marketing Manager
Kubernetes
 minutes
Building a single pane of glass for enterprise Kubernetes fleets

A Kubernetes single pane of glass is a centralized management layer that unifies visibility, access control, cost allocation, and policy enforcement across § cluster in an enterprise fleet for all cloud providers. It replaces the fragmented practice of switching between AWS, GCP, and Azure consoles to govern infrastructure, giving platform teams a single source of truth for multi-cloud Kubernetes operations.

Mélanie Dallé
Senior Marketing Manager
Kubernetes
 minutes
How to deploy a Docker container on Kubernetes (and why manual YAML fails at scale)

Deploying a Docker container on Kubernetes requires building an image, authenticating with a registry, writing YAML deployment manifests, configuring services, and executing kubectl commands. While necessary to understand, executing this manual workflow across thousands of clusters causes severe configuration drift. Enterprise platform teams use agentic platforms to automate the entire deployment lifecycle.

Mélanie Dallé
Senior Marketing Manager
Kubernetes
Terraform
 minutes
Managing Kubernetes deployment YAML across multi-cloud enterprise fleets

At enterprise scale, managing provider-specific Kubernetes YAML across multiple clouds creates crippling configuration drift and operational toil. By adopting an agentic Kubernetes management platform, infrastructure teams abstract cloud-specific configurations (like ingress controllers and storage classes) into a single, declarative intent that automatically reconciles across 1,000+ clusters.

Mélanie Dallé
Senior Marketing Manager
Kubernetes
Cloud
AI
FinOps
 minutes
GPU orchestration guide: How to auto-scale Kubernetes clusters and slash AI infrastructure costs

To stop GPU costs from destroying SaaS margins, teams must transition from static to consumption-based infrastructure by utilizing Karpenter for dynamic provisioning, maximizing hardware density with NVIDIA MIG, and leveraging Qovery to tie scaling directly to business metrics.

Mélanie Dallé
Senior Marketing Manager
Product
AI
Deployment
 minutes
Stop Guessing, Start Shipping. AI-Powered Deployment Troubleshooting

AI is helping developers write more code, faster than ever. But writing code is only half the story. What happens after? Building, deploying, debugging, scaling. That's where teams still lose hours.We're building Qovery for this era. Not just to deploy your code, but to make everything that comes after writing it just as fast.

Alessandro Carrano
Head of Product
AI
Developer Experience
Kubernetes
 minutes
MCP Server is the future of your team's incident’s response

Learn how to use the Model Context Protocol (MCP) to transform static runbooks into intelligent, real-time investigation tools for Kubernetes and cert-manager.

Romain Gérard
Staff Software Engineer

It’s time to change
the way you manage K8s

Turn Kubernetes into your strategic advantage with Qovery, automating the heavy lifting while you stay in control.