At Qovery, we take great care about the global reactivity of our product and in this article, we are going to dismantle the last freeze between two pages that we experienced because we learned many interesting things during the fixing process.
When you build a SPA product one of your first preoccupations is to keep everything fast. You click, and you get instantly a feedback. If you click on a link, you want to navigate instantly to the desired page. If when you click you have to wait for some time before feedback, the user experience quickly becomes horrible.


At Qovery, we take great care about the global reactivity of our product and in this article, we are going to dismantle the last freeze between two pages that we experienced because we learned many interesting things during the fixing process.
As you can see in the video, in our interface, there are two tabs: Overview and Deployments. Pay attention to the mouse click, can you see what’s wrong here? That’s right, there is a gap of about 400 milliseconds between the actual click and the moment the Deployments tab shows its content.

400 milliseconds might sound like it’s nothing, but in terms of browsing experience, it is HUGE. In order to fix this, we need to understand why switching from one tab to the other takes so long.
There aren’t that many elements on the page, so let’s do it the hard way, by commenting each component until we can identify the culprit. If we can find the component that is responsible for the delay, we will then be able to inspect it, and hopefully figure out the underlying cause (could be a Javascript issue, among other things).
First things first, let’s comment the big table. My intuition tells me that it might be a good suspect.
Bingo! Commenting the table component made the tab switch instant, meaning there is definitely something going on with that table.
Knowing that the table is the key, let’s read its code, as well as the code of its parent. Alas, we cannot find any Javascript code anywhere that could cause such a delay. No blocking
Hold on, what if the freeze was linked to a rendering issue? I have already experienced something similar in another project. I’ve learnt that, when trying to render a table with a huge amount of rows, the browser can sometimes freeze the whole tab to focus on the rendering part of the job.
During that kind of freeze, as a user, you can’t see any CSS animation, or any Javascript animation. The rendering process is simply blocked. You don’t get any feedback from your browser. The page is completely and utterly frozen.
It seems like it’s exactly what’s happening here. The browser freezes everything while it is striving to render and paint this big new table node element. And once it’s done, everything magically goes back to normal.
To keep this article a short and easy read, we are not going to dive too deep into why the browser behaves like this. If you want more insight into this, I recommend reading this article : Inside look at modern web browser (part 3) on the Chrome Developers blog. Insanely interesting.
Now, back to our situation. What do we do now?
A quick team chat provides us with a likely solution. Here’s what we’re thinking:
This approach seems rather cool and easy to implement!
Spoiler:
It failed miserably.
But it did lead to some really interesting React behaviors…
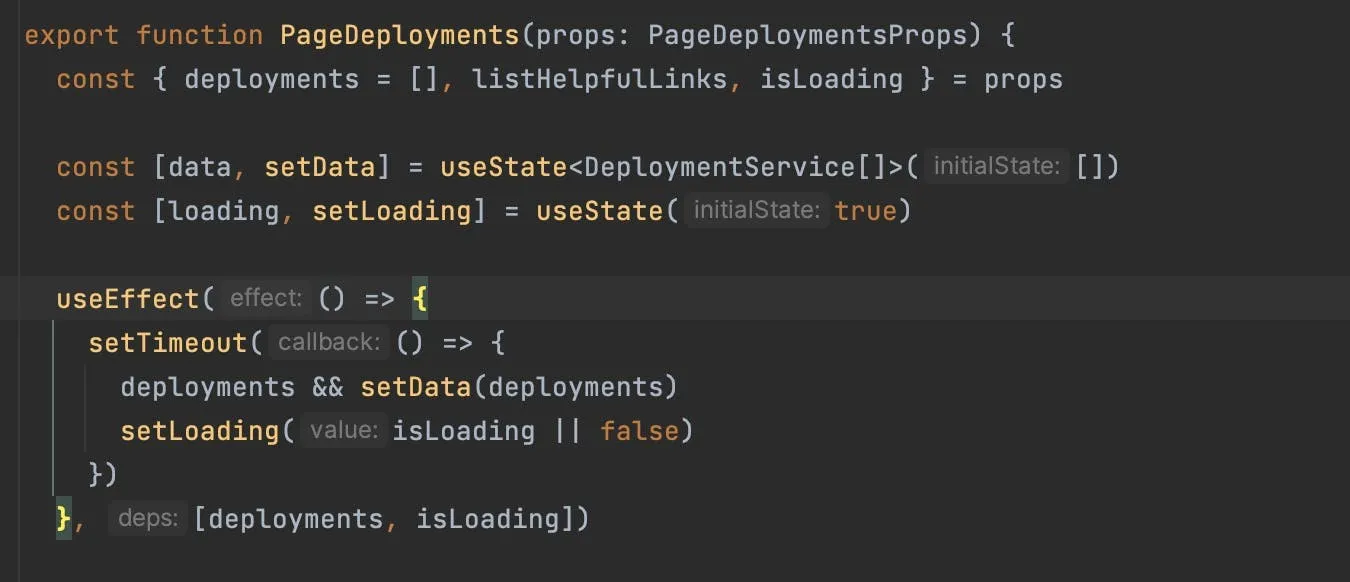
The table is waiting for some data.
When we initialize the parent (the deployments tab), we initialize data as an empty array [].
At that point, our brains are going like this:
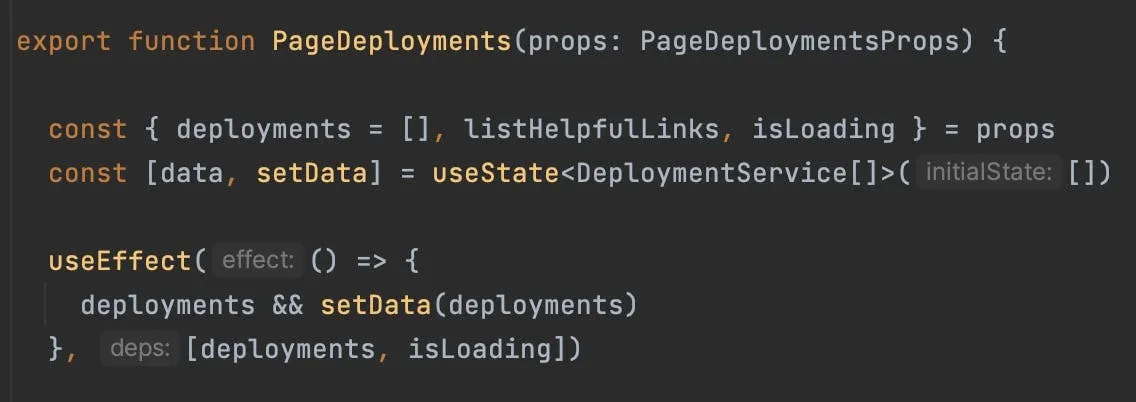
So we have:
Aaaaaannnd… It did not work.
How odd. The Javascript execution follows the procedure to the letter. A quick console.log() method allows us to view the first render with empty data, followed by the useEffect, and then the second render with the data filled up.
And yet, the issue is still there, we can see it with our own two eyes. After we click, the browser freezes, and then the whole
The answer to that question is rather technical, and has been wonderfully covered by Vladimir Klepov in his article useEffect Sometimes fires before paint. To put it simply, even if React renders its code in its Virtual Document Object Model (DOM), the order to paint the real DOM is not always sent to the browser at every React render. Sometimes, React can simply decide to postpone the real DOM painting a little bit, if it judges that it will perform better like this.
In our case, React only sends out the order to paint the actual page after our useEffect, when the data is filled up. This is why we still experience this terrible freeze.
To force React to paint our Virtual DOM with empty data, in the useEffect, let’s add a very short
In the following video, you can clearly see the two-step rendering:
First: the tab activation.
Second: the table rendering.
With this scenario, the browser still freezes, but the user experience is ten times better because, at least, the user action triggers instant feedback.
Improving performance and page speed is a full-time job when it comes to SPA projects. It is, most definitely, a highly interesting area of work, which can help developers learn a lot about how React and browsers work. And what’s even more rewarding is that the quality of your work in that area can directly impact the experience of thousands of users in a positive way.
Sometimes, you have to come up with hacks. Sometimes, you find a more elegant solution for the same problem a few weeks later. At Qovery, we believe that sharing our findings is the best way to discover even better ones. If you think our setTimeout workaround inside a useEffect is not the best way of dealing with this issue, feel free to share your own approach with us. We are always happy to share, and eager to learn!
Pssst… The repository of Qovery frontend console is open source. Come and have a look! ;)
Benjamin is a staff engineer at Qovery focused on infrastructure automation, Kubernetes internals, and building the deployment engine that powers thousands of clusters.
Qovery ensures every agent action is scoped, audited, and policy-checked. Start deploying in under 10 minutes.