> ## Documentation Index
> Fetch the complete documentation index at: https://www.qovery.com/docs/llms.txt
> Use this file to discover all available pages before exploring further.
# Qovery Observe
> Built-in observability for monitoring applications and infrastructure
## Overview
Qovery provides integrated observability to help you monitor the health, performance, and behavior of your services directly within the Qovery Console. Your observability data stays within your infrastructure with zero maintenance required.
 Supports Applications, Containers, and Managed Databases (Jobs support coming soon).
Qovery Observe is not yet self-service. Contact Qovery via Slack or email to get access.
## Features
Real-time service health and performance tracking
CPU, memory, network, request latency, and error rates
12 weeks log retention with automatic error detection
Qovery and Kubernetes events (deployments, scaling, failures)
Proactive monitoring with customizable alerts and notifications
Supports Applications, Containers, and Managed Databases (Jobs support coming soon).
Qovery Observe is not yet self-service. Contact Qovery via Slack or email to get access.
## Features
Real-time service health and performance tracking
CPU, memory, network, request latency, and error rates
12 weeks log retention with automatic error detection
Qovery and Kubernetes events (deployments, scaling, failures)
Proactive monitoring with customizable alerts and notifications
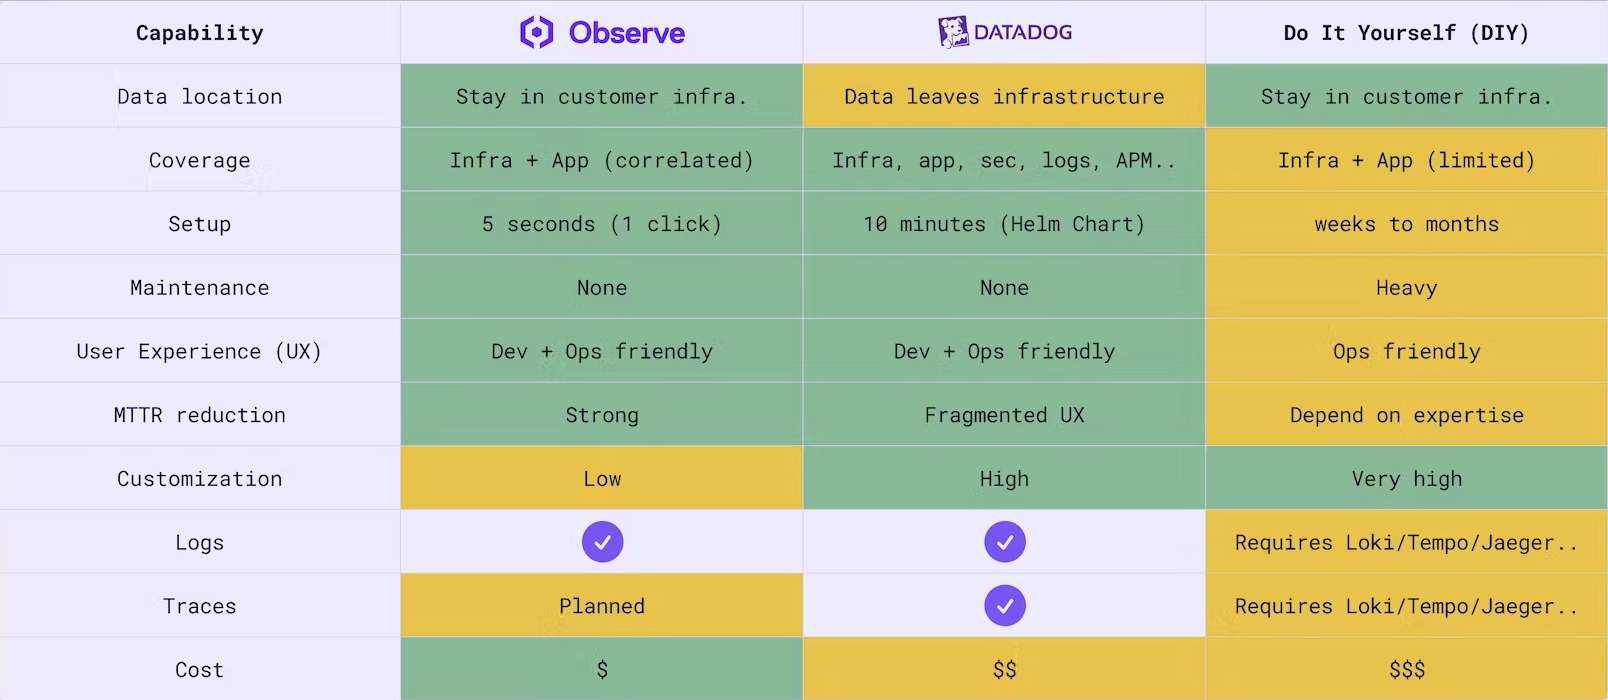 ## Key Benefits
* **Data stays in your infrastructure**: All observability data remains within your cloud
* **Zero maintenance**: No configuration or management required
* **Correlated data**: Metrics and logs automatically linked for faster troubleshooting
## Architecture
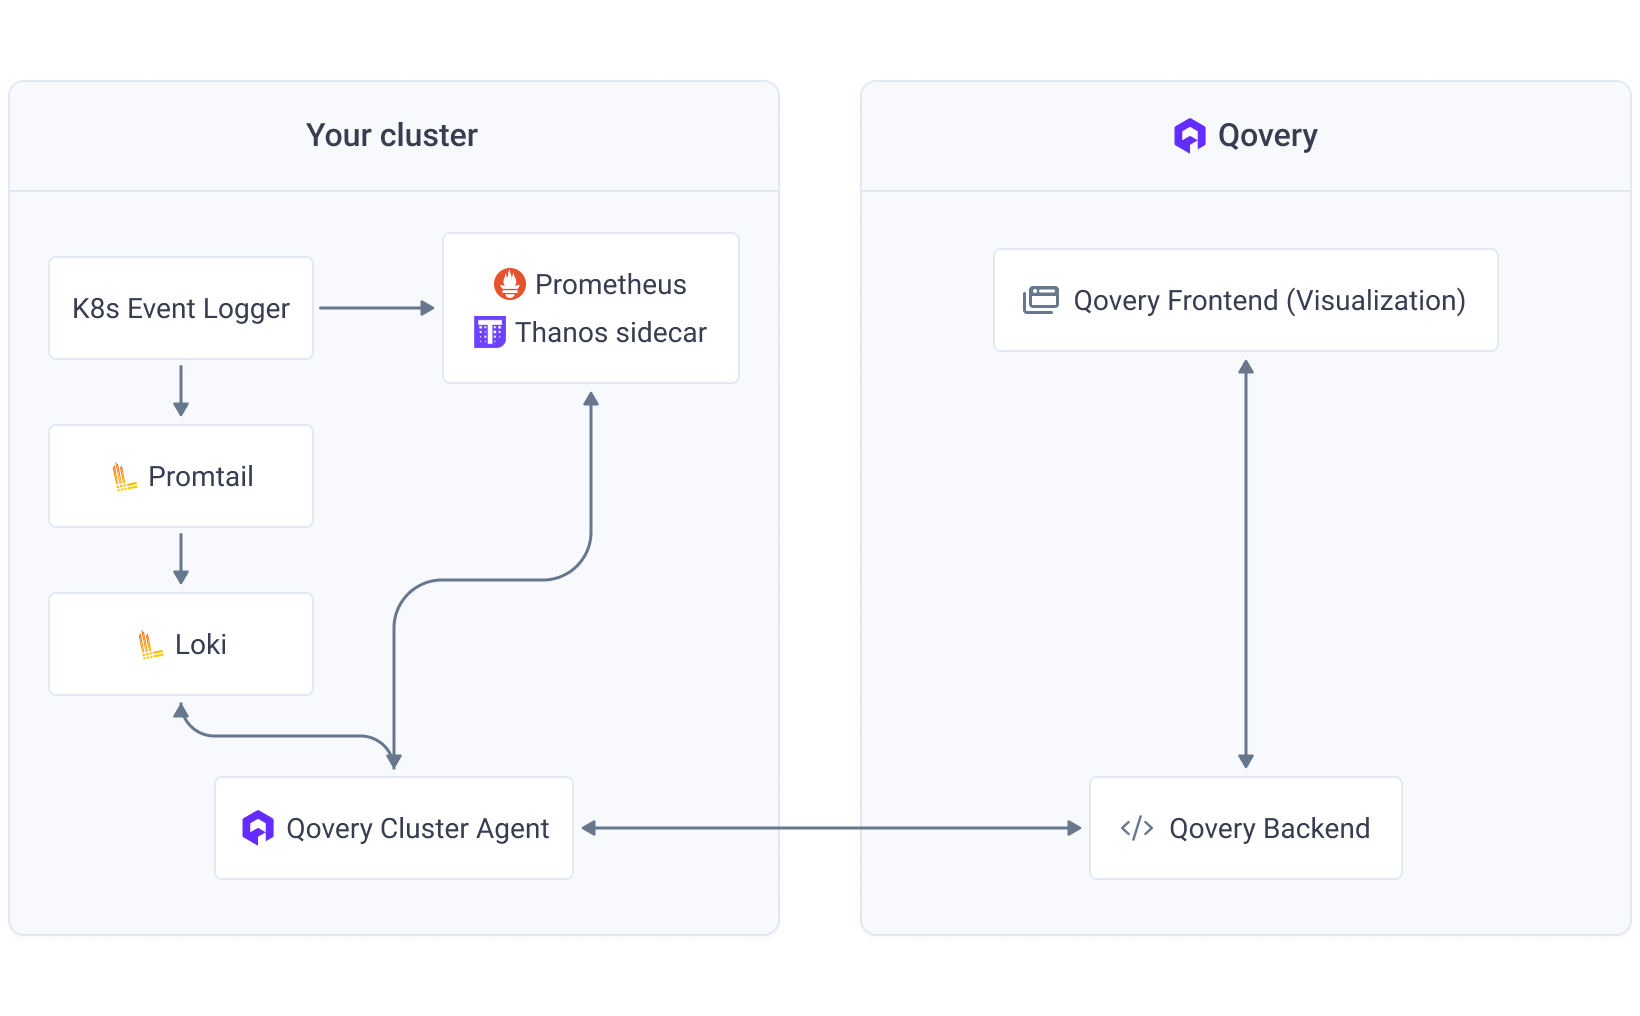
Qovery's observability combines open-source tools to monitor your Kubernetes infrastructure:
### Data Collection
**Prometheus + Thanos** collect and store metrics (CPU, memory, network)
**Loki + Promtail** collect and store container logs
**Qovery Event Logger** captures Kubernetes events
### Data Retention
* **Prometheus**: 7-day local retention
* **Thanos**: Raw metrics (15 days), 5-minute resolution (30 days), 1-hour resolution (30 days)
* **Loki**: 12-week log retention
### Key Features
* **Per-cluster isolation**: Data protection and performance optimization
* **Automatic error detection**: Custom metrics track error logs for alerting
* **High availability**: Prometheus runs with 2 replicas; Thanos auto-scales 2-5 replicas
### Architecture Diagram
## Key Benefits
* **Data stays in your infrastructure**: All observability data remains within your cloud
* **Zero maintenance**: No configuration or management required
* **Correlated data**: Metrics and logs automatically linked for faster troubleshooting
## Architecture
Qovery's observability combines open-source tools to monitor your Kubernetes infrastructure:
### Data Collection
**Prometheus + Thanos** collect and store metrics (CPU, memory, network)
**Loki + Promtail** collect and store container logs
**Qovery Event Logger** captures Kubernetes events
### Data Retention
* **Prometheus**: 7-day local retention
* **Thanos**: Raw metrics (15 days), 5-minute resolution (30 days), 1-hour resolution (30 days)
* **Loki**: 12-week log retention
### Key Features
* **Per-cluster isolation**: Data protection and performance optimization
* **Automatic error detection**: Custom metrics track error logs for alerting
* **High availability**: Prometheus runs with 2 replicas; Thanos auto-scales 2-5 replicas
### Architecture Diagram
 ## Monitoring
Access the **Monitoring** tab at the service level to view real-time and historical application data.
### Service Health
Monitor your service health with:
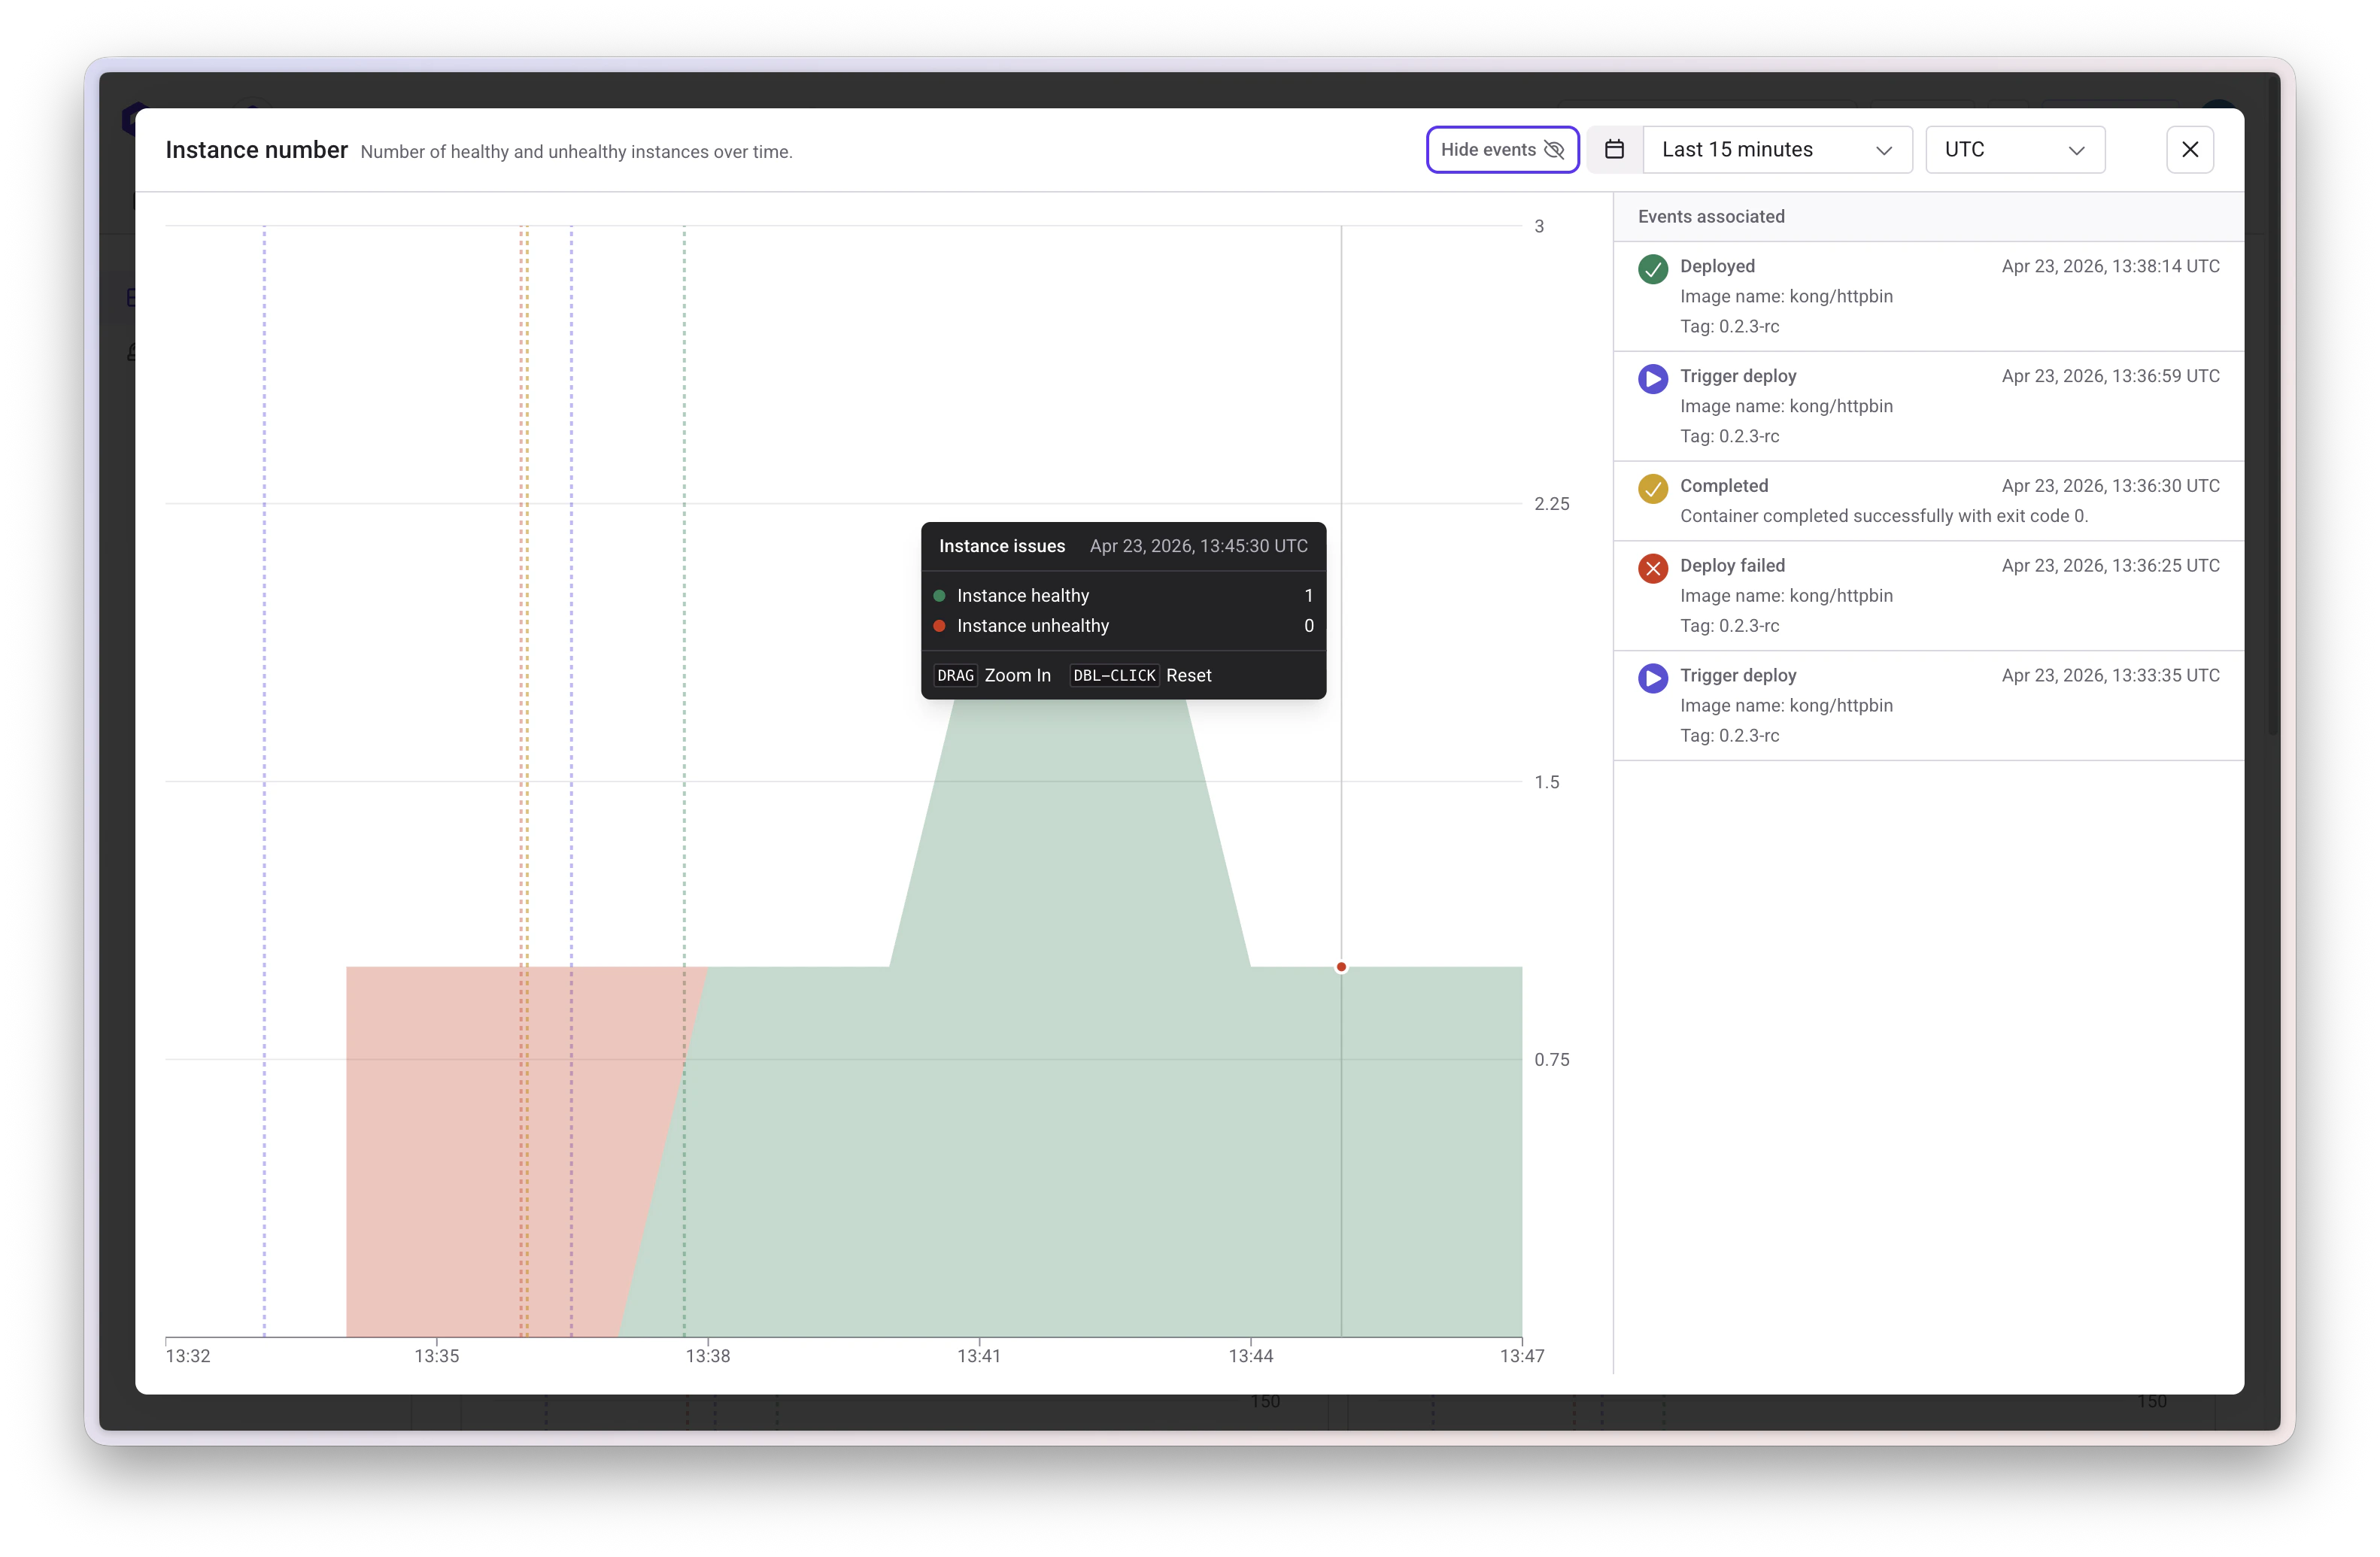
* **Event tracking**: Qovery events (deployments, failures) and Kubernetes events (autoscaler triggers, OOMKilled pods, health check issues)
* **Error logging**: Automatically counts error-level logs with direct navigation to errors
* **HTTP error metrics**: Aggregated 499 and 5xx error rates by endpoint and status code
* **Request latency**: P99 tail latency visualization (expandable to P90 and P50)
## Monitoring
Access the **Monitoring** tab at the service level to view real-time and historical application data.
### Service Health
Monitor your service health with:
* **Event tracking**: Qovery events (deployments, failures) and Kubernetes events (autoscaler triggers, OOMKilled pods, health check issues)
* **Error logging**: Automatically counts error-level logs with direct navigation to errors
* **HTTP error metrics**: Aggregated 499 and 5xx error rates by endpoint and status code
* **Request latency**: P99 tail latency visualization (expandable to P90 and P50)
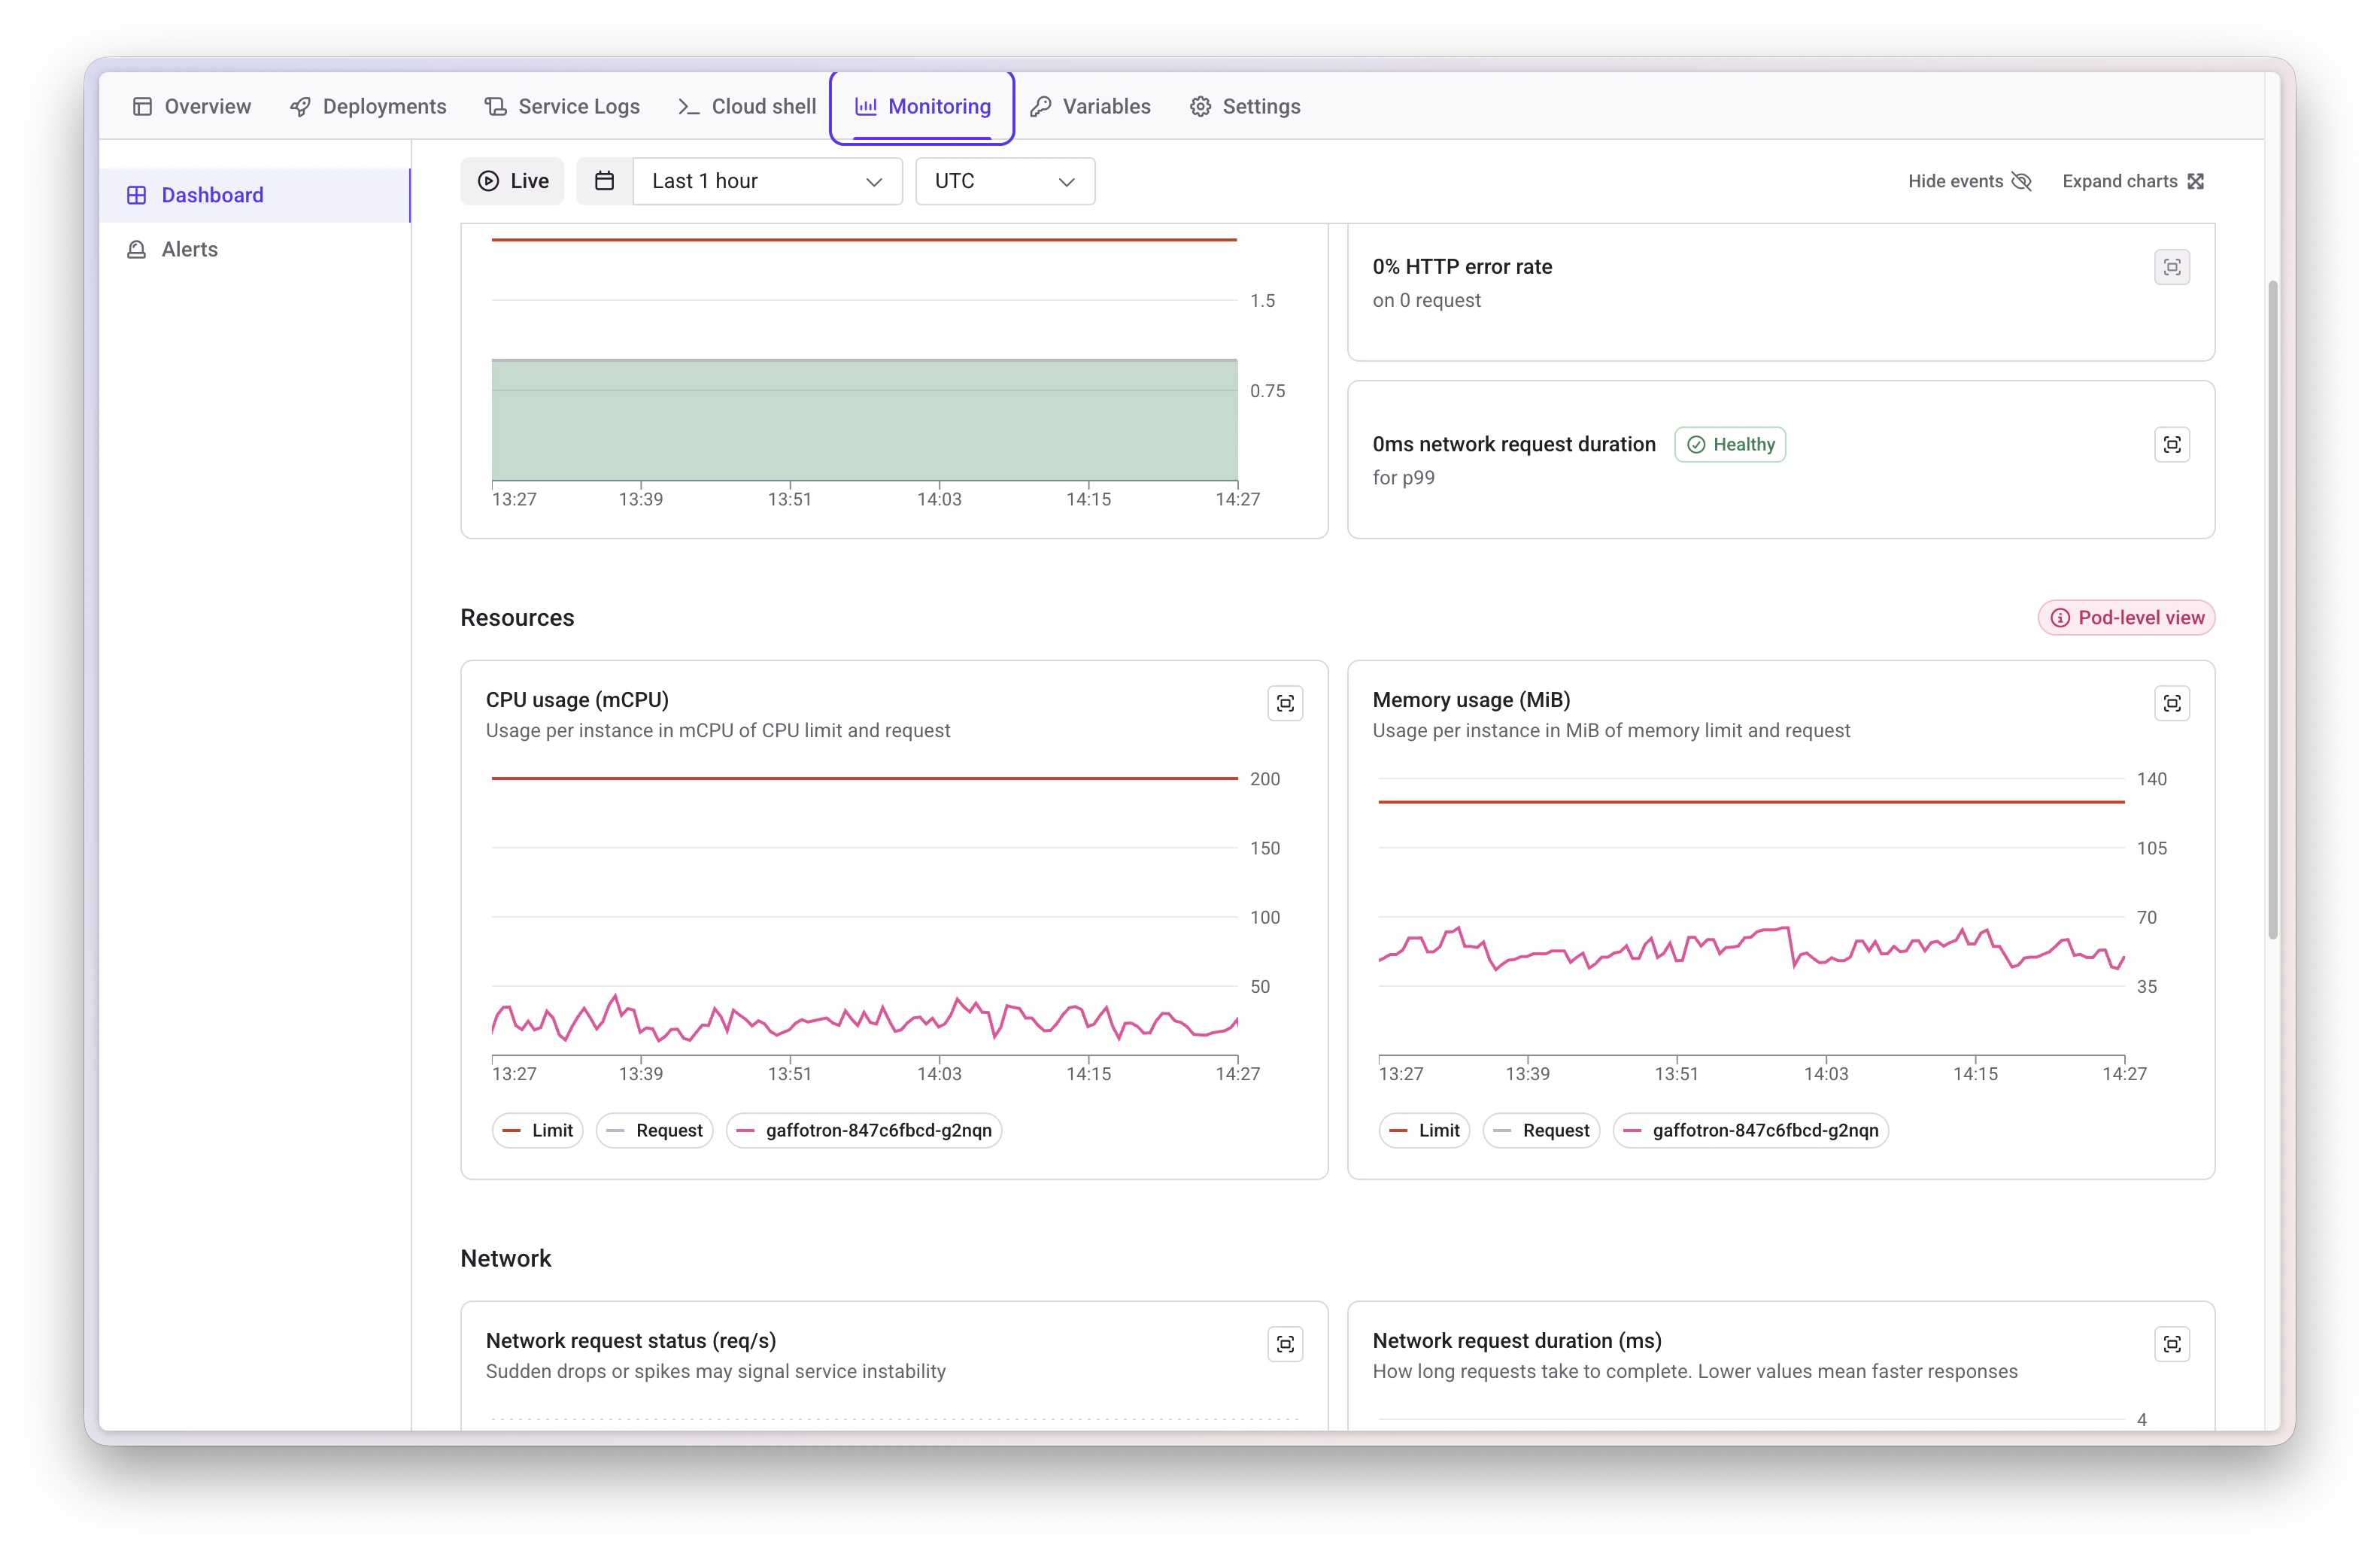
 ### Resource Monitoring
Track per-pod resources:
* **CPU usage**: Against configured requests and limits
* **Memory usage**: Against configured requests and limits
### Resource Monitoring
Track per-pod resources:
* **CPU usage**: Against configured requests and limits
* **Memory usage**: Against configured requests and limits
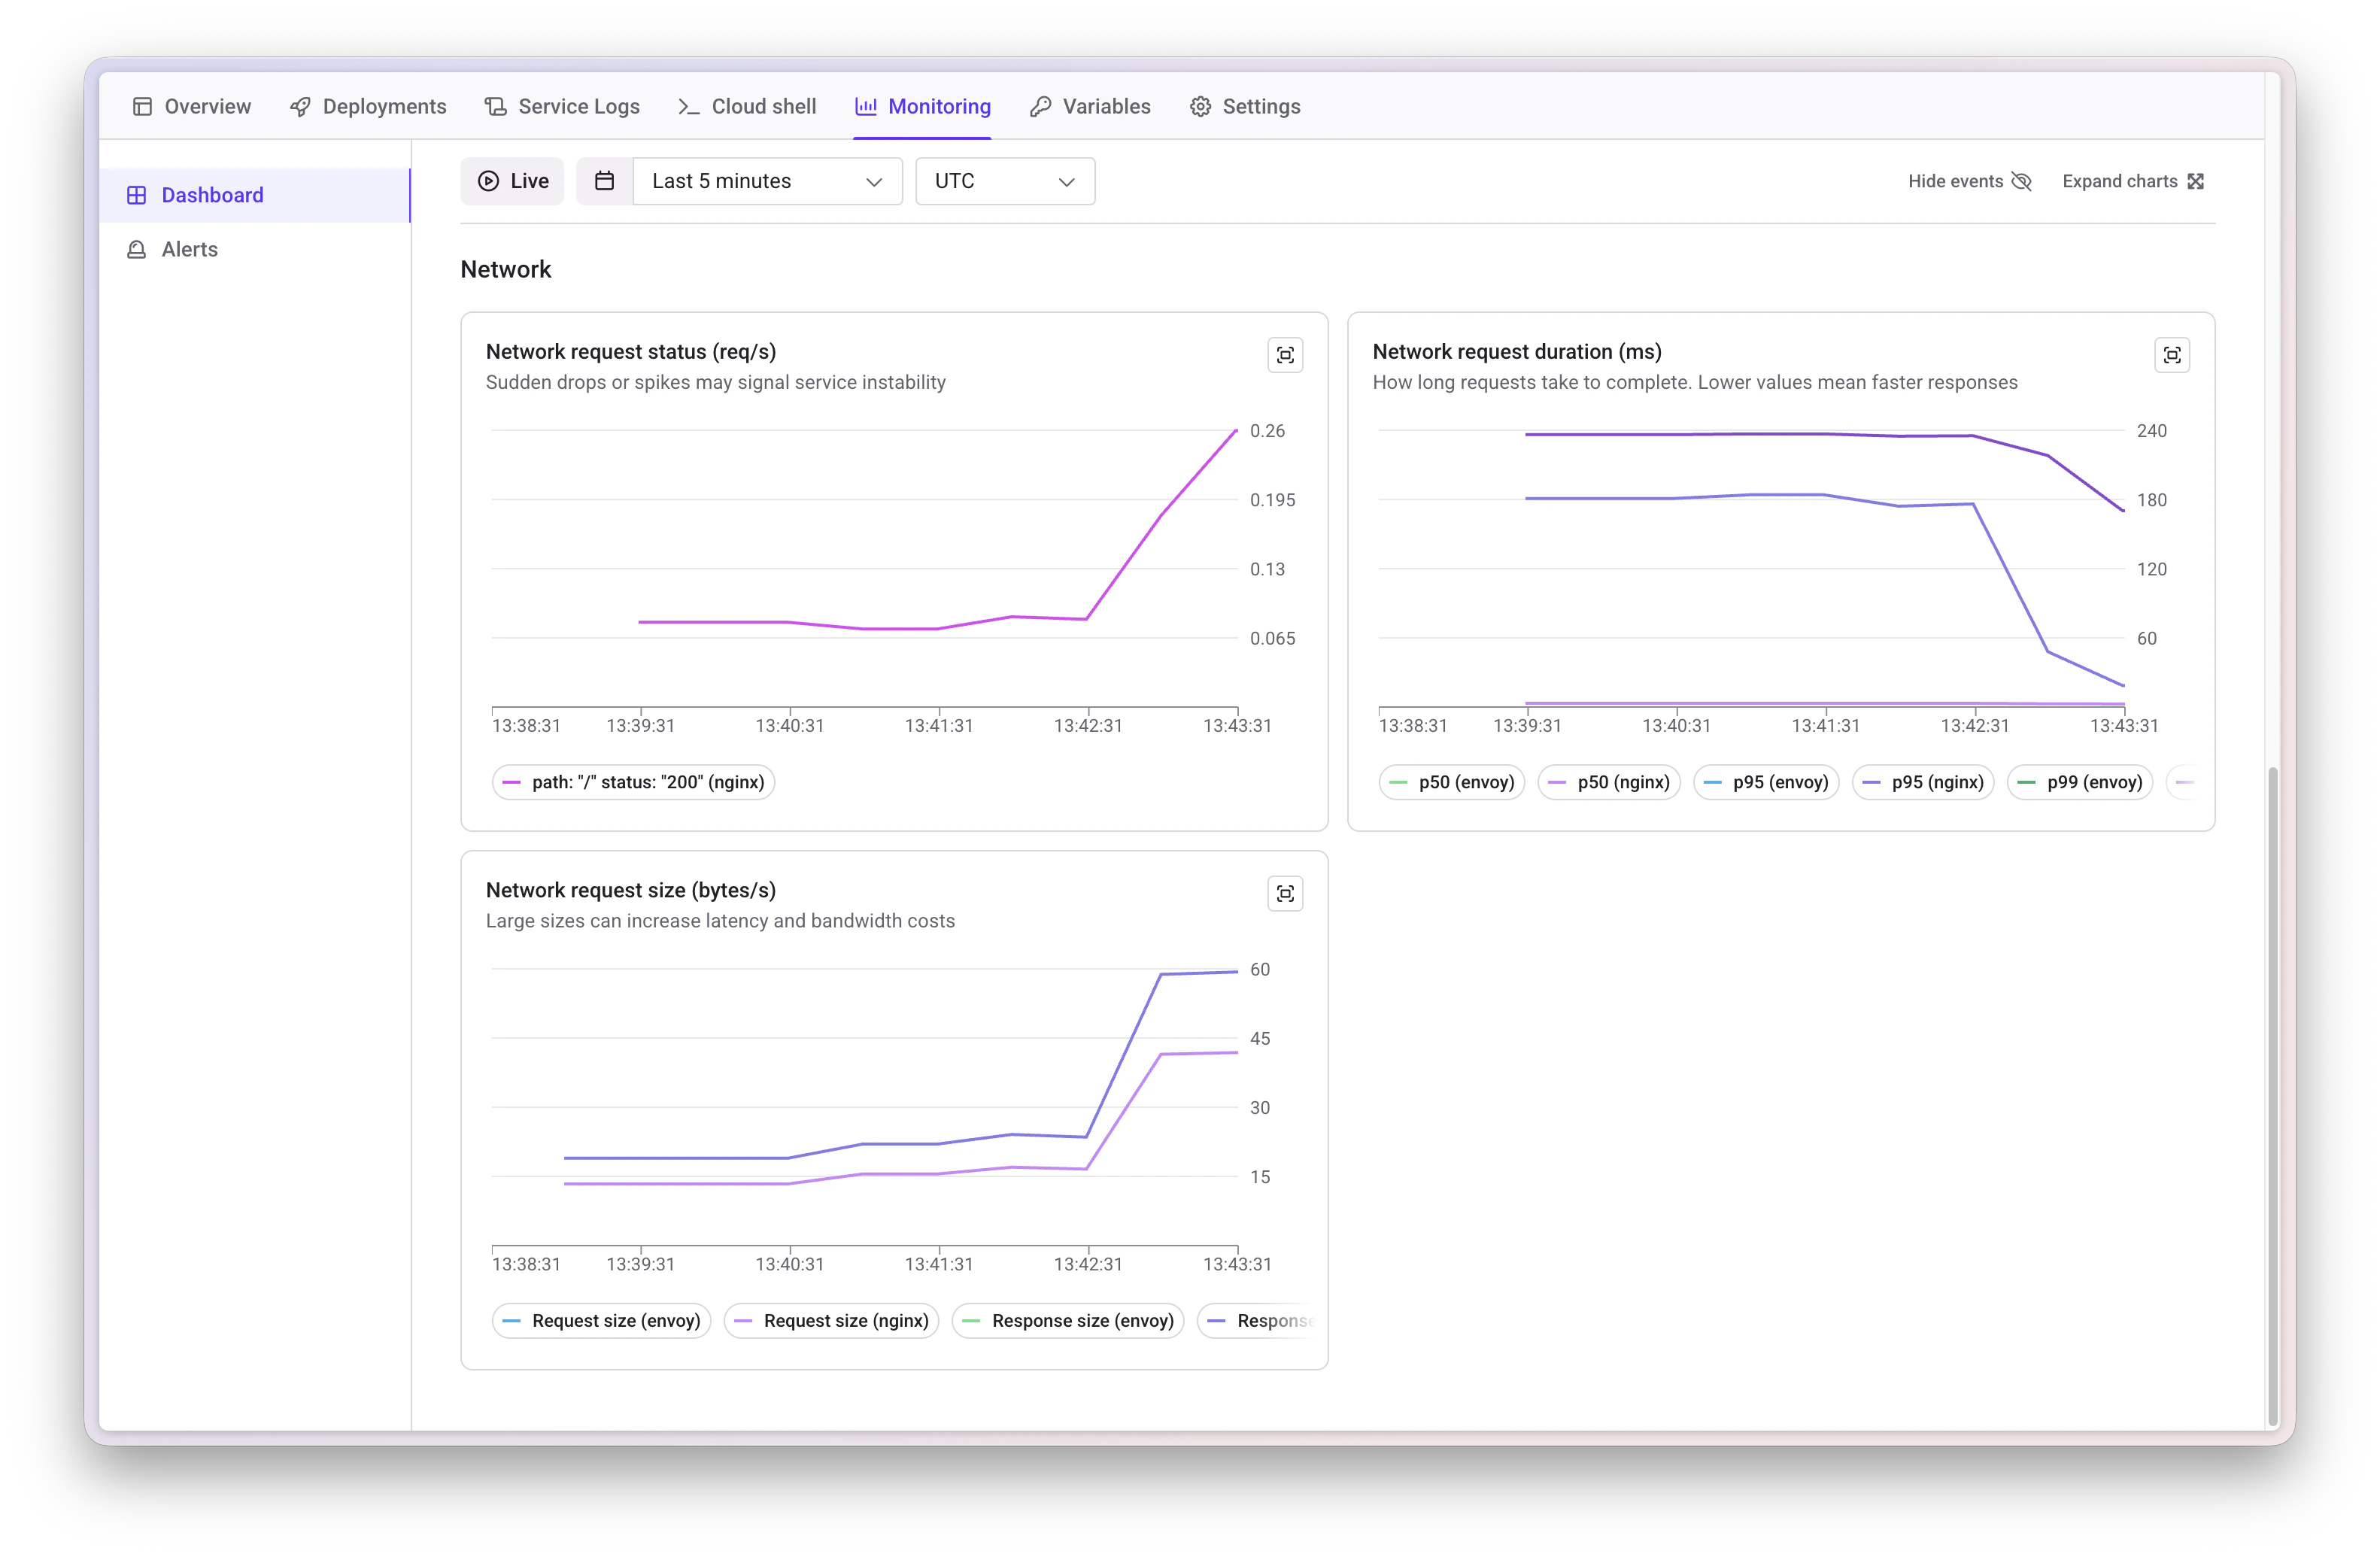
 ### Network Metrics
Monitor network-level data:
* Request status by path and error code
* Request duration (P50, P95, P99 percentiles)
* Request size statistics
Metrics represent ingress traffic for services with public ports or internal cluster traffic otherwise. Scaleway clusters currently lack internal traffic monitoring when no public port is exposed.
### Network Metrics
Monitor network-level data:
* Request status by path and error code
* Request duration (P50, P95, P99 percentiles)
* Request size statistics
Metrics represent ingress traffic for services with public ports or internal cluster traffic otherwise. Scaleway clusters currently lack internal traffic monitoring when no public port is exposed.
 ### Managed Database Monitoring
For AWS managed databases (MySQL and PostgreSQL), Qovery Observe provides comprehensive monitoring of database performance and health metrics.
Managed database monitoring is currently available for AWS only. To enable it, the CloudWatch exporter must be activated on your cluster. This is not currently self-service - contact Qovery via Slack or email to enable this feature.
#### Overview Metrics
Monitor critical database health indicators:
Track average CPU utilization across your database instances
Monitor available RAM and memory consumption patterns
Track active database connections in real-time
Monitor swap memory usage (healthy databases should minimize swap)
Track outstanding disk I/O operations for performance insights
(PostgreSQL only) Monitor transactions pending cleanup operations
#### Query Performance
Track database query performance metrics:
* **Write Latency**: Monitor write operation response times
* **Read Latency**: Track read operation response times
#### Storage & I/O
Monitor disk performance and capacity:
* **Write IOPS**: Operations per second for write operations
* **Read IOPS**: Operations per second for read operations
* **Storage Available**: Track remaining storage capacity percentage
These metrics help you identify performance bottlenecks, optimize query performance, and ensure your database has adequate resources.
### Controls
* **Live update toggle**: Continuous chart refresh
* **Custom time frames**: Select data display ranges
## Logs
Access logs via the **Logs** tab or the Monitoring tab.
### Managed Database Monitoring
For AWS managed databases (MySQL and PostgreSQL), Qovery Observe provides comprehensive monitoring of database performance and health metrics.
Managed database monitoring is currently available for AWS only. To enable it, the CloudWatch exporter must be activated on your cluster. This is not currently self-service - contact Qovery via Slack or email to enable this feature.
#### Overview Metrics
Monitor critical database health indicators:
Track average CPU utilization across your database instances
Monitor available RAM and memory consumption patterns
Track active database connections in real-time
Monitor swap memory usage (healthy databases should minimize swap)
Track outstanding disk I/O operations for performance insights
(PostgreSQL only) Monitor transactions pending cleanup operations
#### Query Performance
Track database query performance metrics:
* **Write Latency**: Monitor write operation response times
* **Read Latency**: Track read operation response times
#### Storage & I/O
Monitor disk performance and capacity:
* **Write IOPS**: Operations per second for write operations
* **Read IOPS**: Operations per second for read operations
* **Storage Available**: Track remaining storage capacity percentage
These metrics help you identify performance bottlenecks, optimize query performance, and ensure your database has adequate resources.
### Controls
* **Live update toggle**: Continuous chart refresh
* **Custom time frames**: Select data display ranges
## Logs
Access logs via the **Logs** tab or the Monitoring tab.
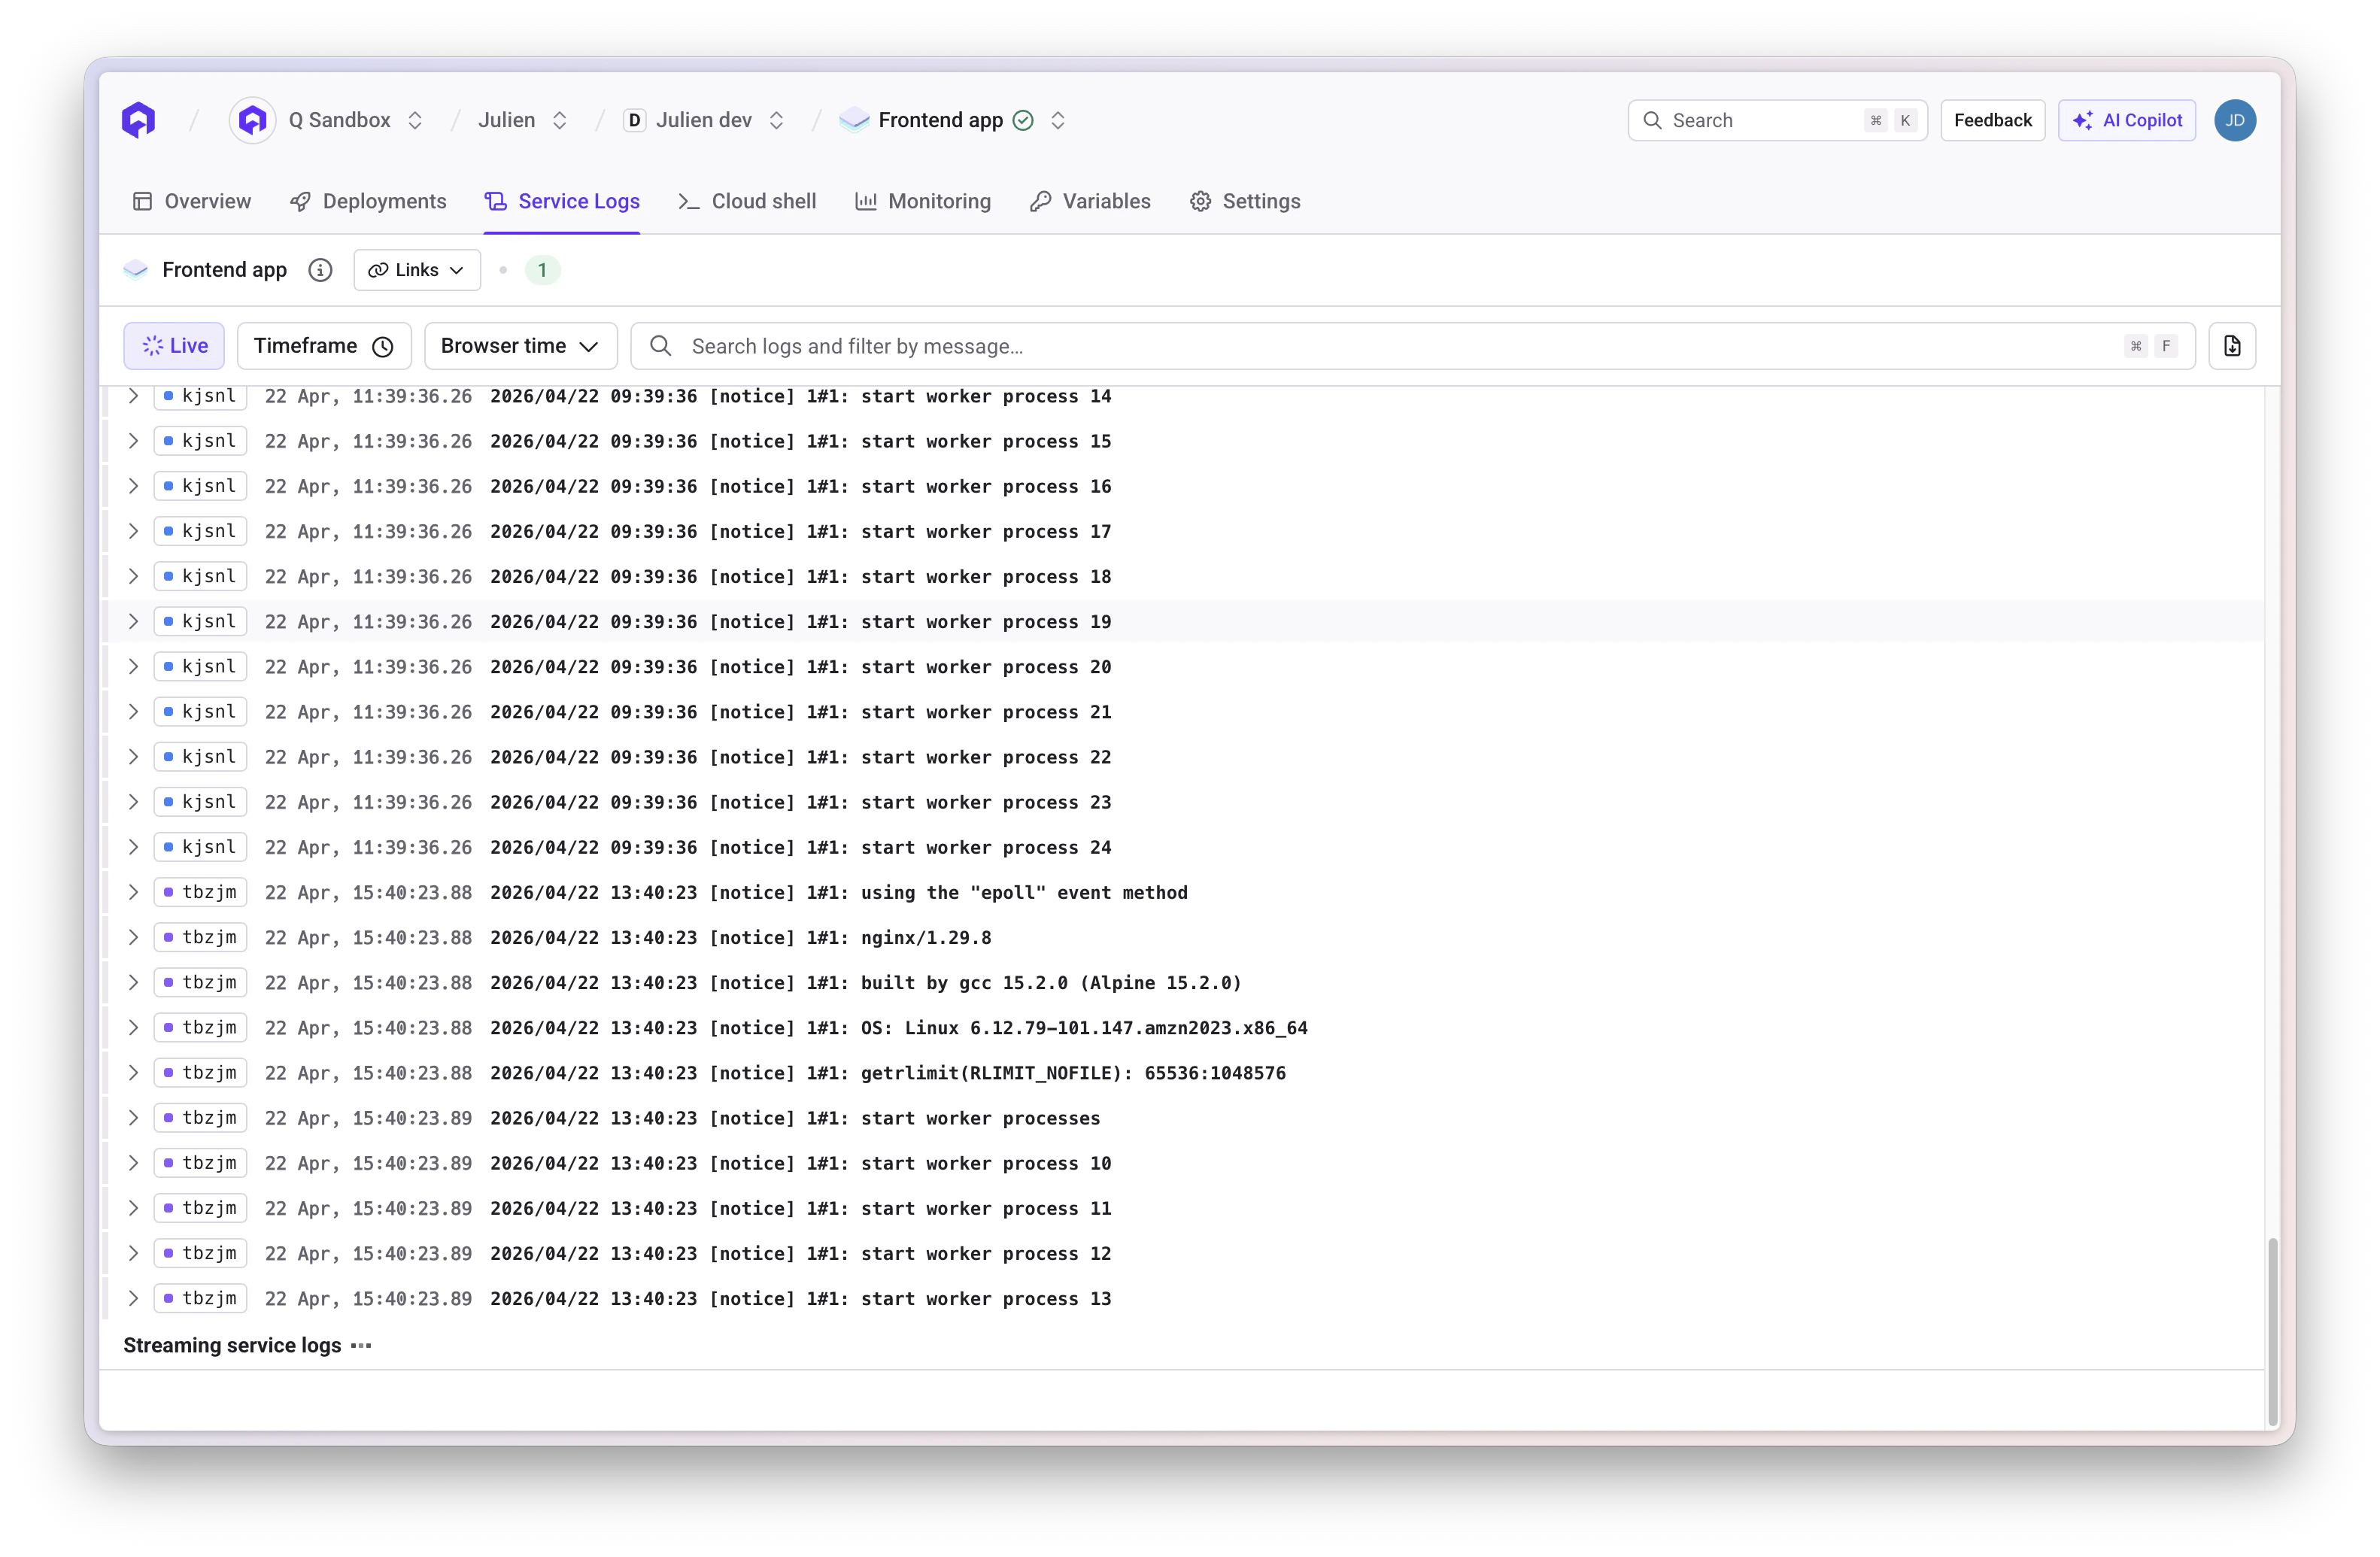 ### Log Features
Qovery collects and stores logs using **Loki + Promtail** with:
* **12 weeks retention** when observability is enabled
* **24 hours retention** without observability
* **Automatic error detection**: Error-level logs are counted and highlighted
* **Log enrichment**: Service ID, environment ID, and pod information
### Filtering Capabilities
Locate specific messages within log entries
Isolate logs around deployments or incidents
Filter by severity (error, info, debug)
## Alerts
Qovery provides a built-in alerting system that proactively monitors your services and notifies you when specific conditions are met. The Alerts section is available at **two levels** in the Console:
| Level | How to access | What you see |
| ------------------------------ | -------------------------------------------------------- | ------------------------------------------------------------------------------------------------------- |
| **Organization (global view)** | Main navigation sidebar > **Alerts** | All alert rules, all active issues, and notification channels across every service in your organization |
| **Service (per-service view)** | Open a service > **Monitoring** tab > **Alerts** sub-tab | Alerts scoped to that specific service only |
### Organization-Level Alerts
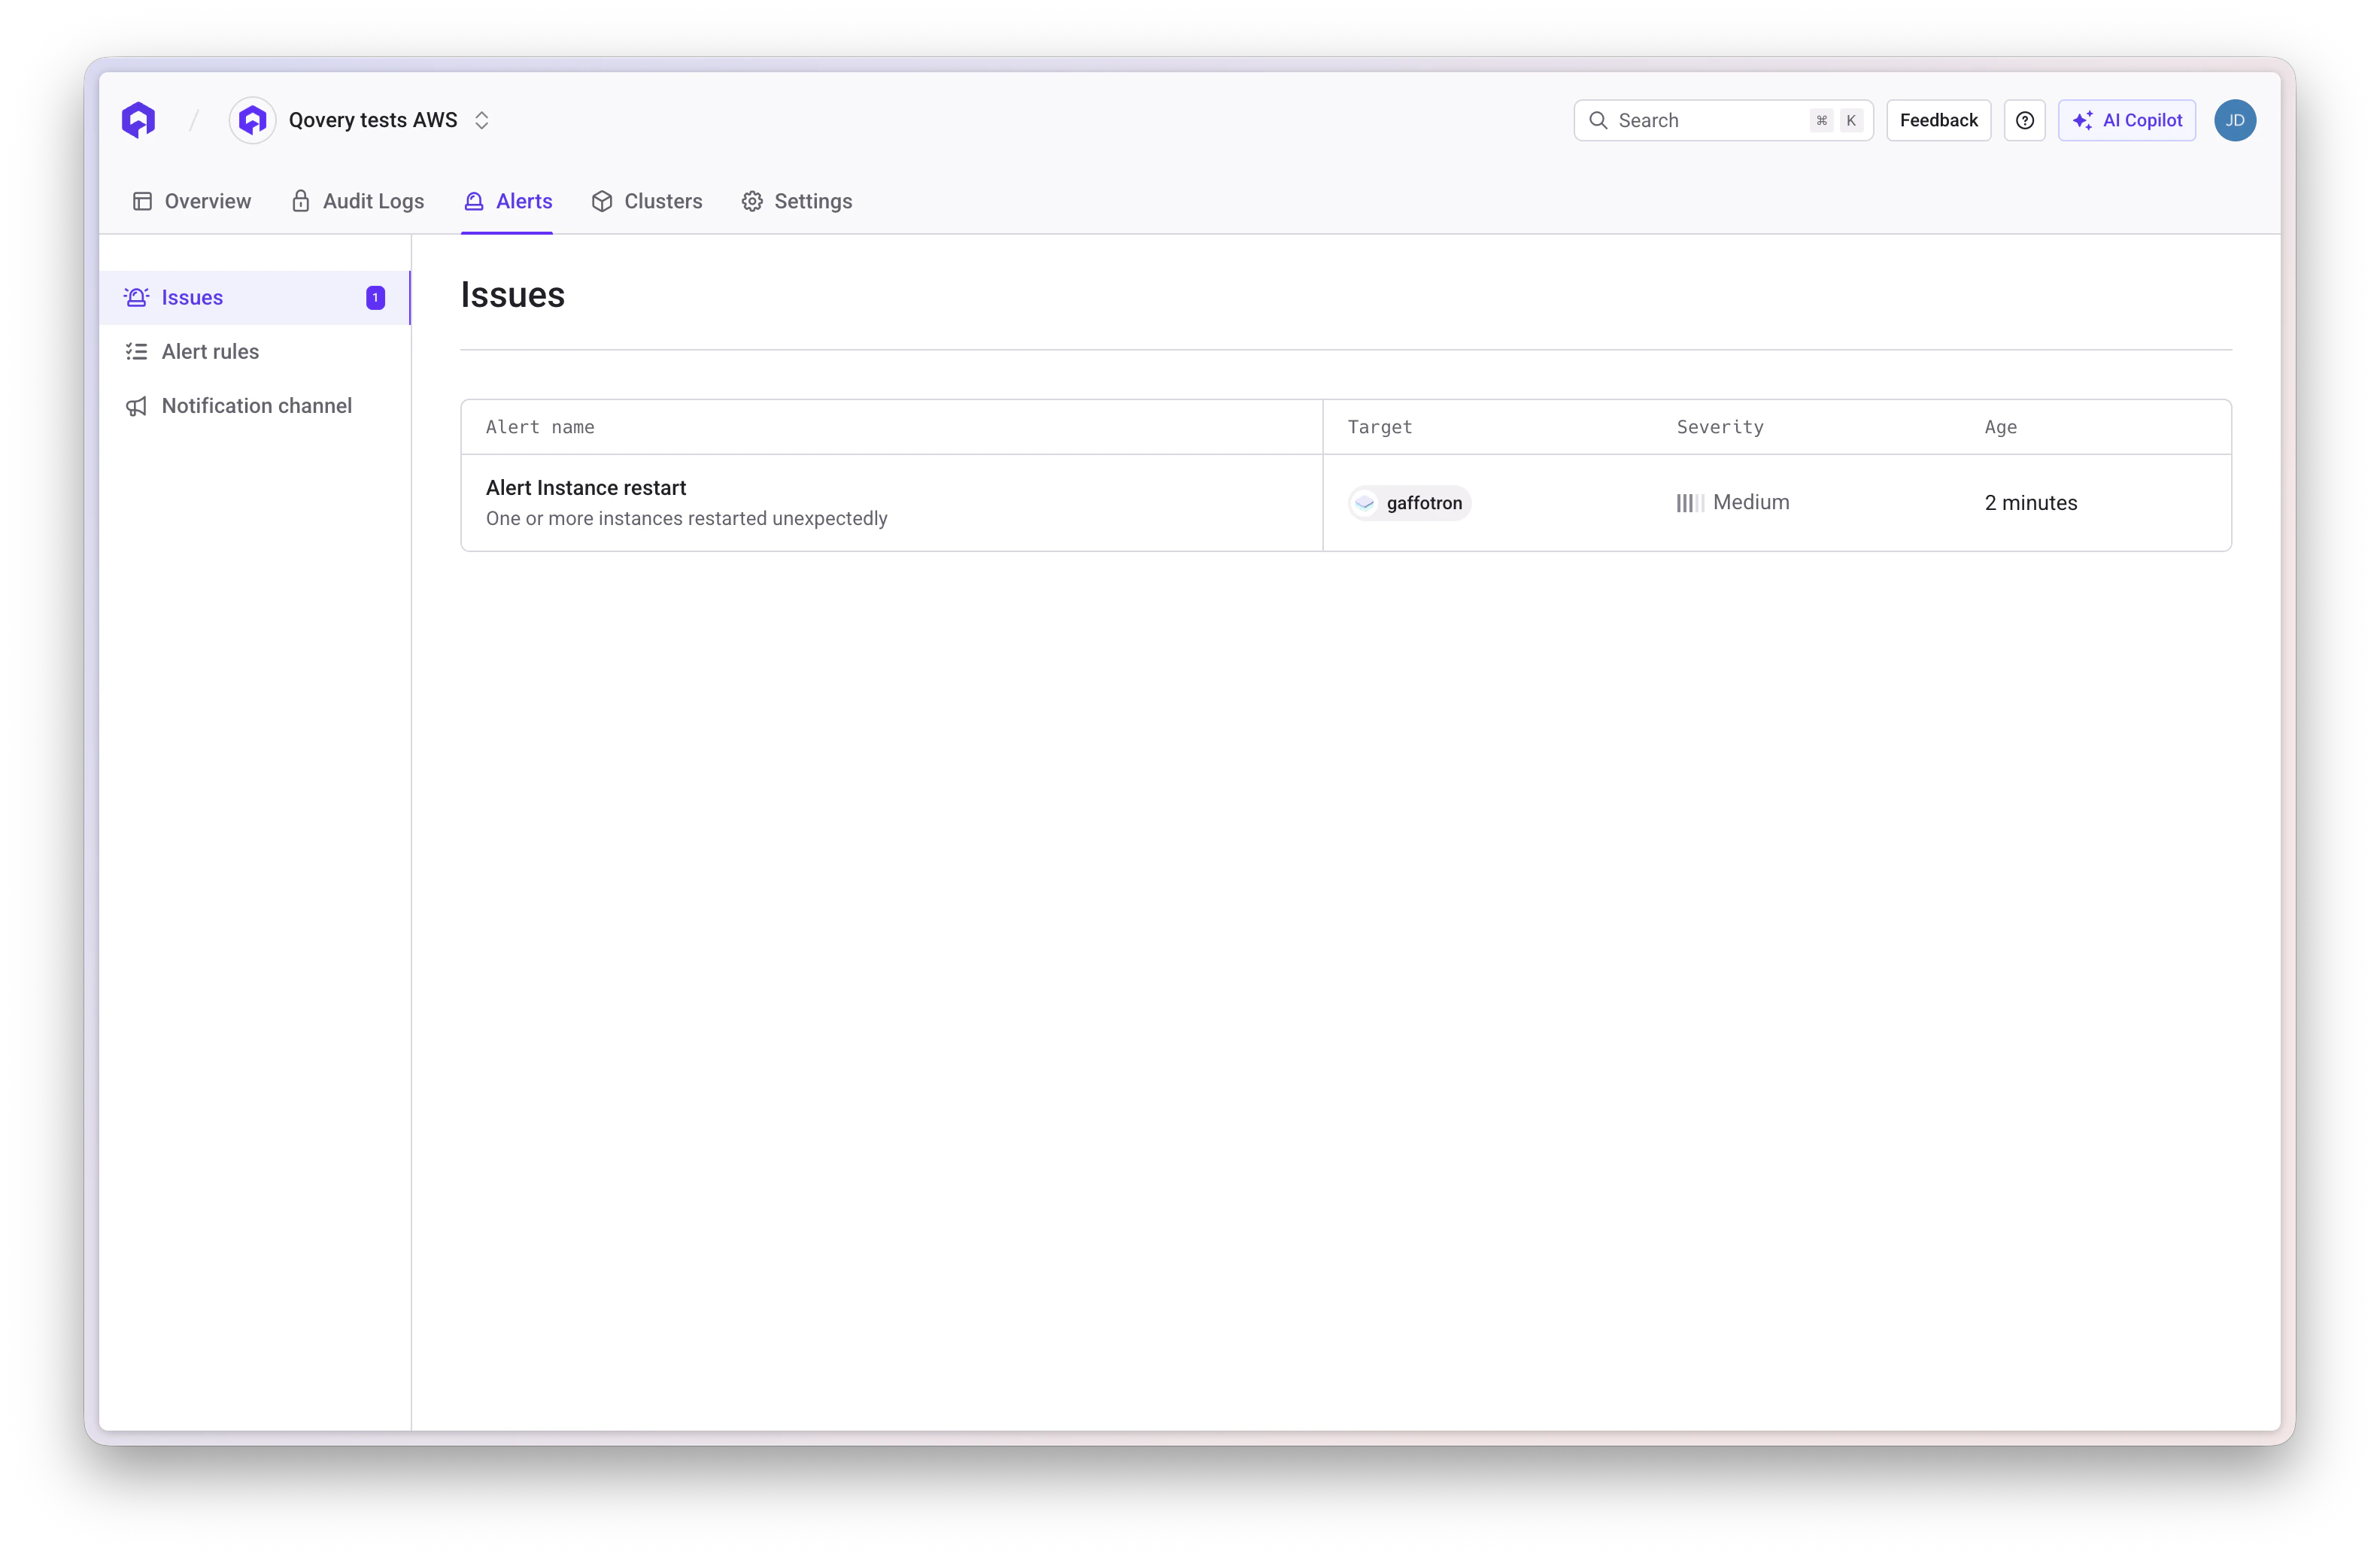
Navigate to the **Alerts** section from the main organization navigation (top-level sidebar item). This gives you a centralized, cross-service view with three sub-pages:
* **Alert rules**: Browse and manage all configured alert rules across all services in the organization
* **Issues**: View all currently fired alerts with their severity, target service, and duration. Each issue shows which alert rule triggered it and how long it has been active.
* **Notification channel**: Configure and manage notification channels (Slack, Email, and more integrations coming soon)
### Log Features
Qovery collects and stores logs using **Loki + Promtail** with:
* **12 weeks retention** when observability is enabled
* **24 hours retention** without observability
* **Automatic error detection**: Error-level logs are counted and highlighted
* **Log enrichment**: Service ID, environment ID, and pod information
### Filtering Capabilities
Locate specific messages within log entries
Isolate logs around deployments or incidents
Filter by severity (error, info, debug)
## Alerts
Qovery provides a built-in alerting system that proactively monitors your services and notifies you when specific conditions are met. The Alerts section is available at **two levels** in the Console:
| Level | How to access | What you see |
| ------------------------------ | -------------------------------------------------------- | ------------------------------------------------------------------------------------------------------- |
| **Organization (global view)** | Main navigation sidebar > **Alerts** | All alert rules, all active issues, and notification channels across every service in your organization |
| **Service (per-service view)** | Open a service > **Monitoring** tab > **Alerts** sub-tab | Alerts scoped to that specific service only |
### Organization-Level Alerts
Navigate to the **Alerts** section from the main organization navigation (top-level sidebar item). This gives you a centralized, cross-service view with three sub-pages:
* **Alert rules**: Browse and manage all configured alert rules across all services in the organization
* **Issues**: View all currently fired alerts with their severity, target service, and duration. Each issue shows which alert rule triggered it and how long it has been active.
* **Notification channel**: Configure and manage notification channels (Slack, Email, and more integrations coming soon)
 ### Service-Level Alerts
Each service (Application or Container) has a dedicated **Monitoring** tab that includes two sub-tabs:
* **Dashboard**: Real-time metrics visualization with graphs for CPU, memory, network, and latency
* **Alerts**: View and create alerts scoped to this specific service
The **Alerts** sub-tab is only visible when alerting is enabled on the cluster (Cluster settings > General > Alerting).
Navigate to a service > click the **Monitoring** tab > select the **Alerts** sub-tab to create or review alerts for that service.
To receive alerts, you first need to configure a notification channel. See the [Slack Integration guide](/docs/configuration/integrations/slack) or [Email Integration guide](/docs/configuration/integrations/email) to set up notification channels.
### Alert Categories
Create alerts based on these monitoring categories:
Monitor CPU usage thresholds and spikes
Track memory consumption and prevent OOM issues
Detect elevated 5xx server error rates
Alert on slow response times and performance degradation
Get notified when services can't reach minimum instance count
Track unexpected pod restarts and crashes
Alert when service reaches maximum instance limit
### Creating an Alert
Choose the type of alert you want to create (CPU, Memory, HTTP Errors, etc.)
Define the trigger conditions for your alert:
* View the underlying query powering the alert
* Customize threshold values and duration
* Preview how the condition evaluates against your metrics
Set up the alert notification:
* **Alert name**: Descriptive name for easy identification
* **Notification message**: Custom text included in notifications
* **Notification channel**: Select a configured notification channel (Slack, Email, or more integrations coming soon)
### Service-Level Alerts
Each service (Application or Container) has a dedicated **Monitoring** tab that includes two sub-tabs:
* **Dashboard**: Real-time metrics visualization with graphs for CPU, memory, network, and latency
* **Alerts**: View and create alerts scoped to this specific service
The **Alerts** sub-tab is only visible when alerting is enabled on the cluster (Cluster settings > General > Alerting).
Navigate to a service > click the **Monitoring** tab > select the **Alerts** sub-tab to create or review alerts for that service.
To receive alerts, you first need to configure a notification channel. See the [Slack Integration guide](/docs/configuration/integrations/slack) or [Email Integration guide](/docs/configuration/integrations/email) to set up notification channels.
### Alert Categories
Create alerts based on these monitoring categories:
Monitor CPU usage thresholds and spikes
Track memory consumption and prevent OOM issues
Detect elevated 5xx server error rates
Alert on slow response times and performance degradation
Get notified when services can't reach minimum instance count
Track unexpected pod restarts and crashes
Alert when service reaches maximum instance limit
### Creating an Alert
Choose the type of alert you want to create (CPU, Memory, HTTP Errors, etc.)
Define the trigger conditions for your alert:
* View the underlying query powering the alert
* Customize threshold values and duration
* Preview how the condition evaluates against your metrics
Set up the alert notification:
* **Alert name**: Descriptive name for easy identification
* **Notification message**: Custom text included in notifications
* **Notification channel**: Select a configured notification channel (Slack, Email, or more integrations coming soon)
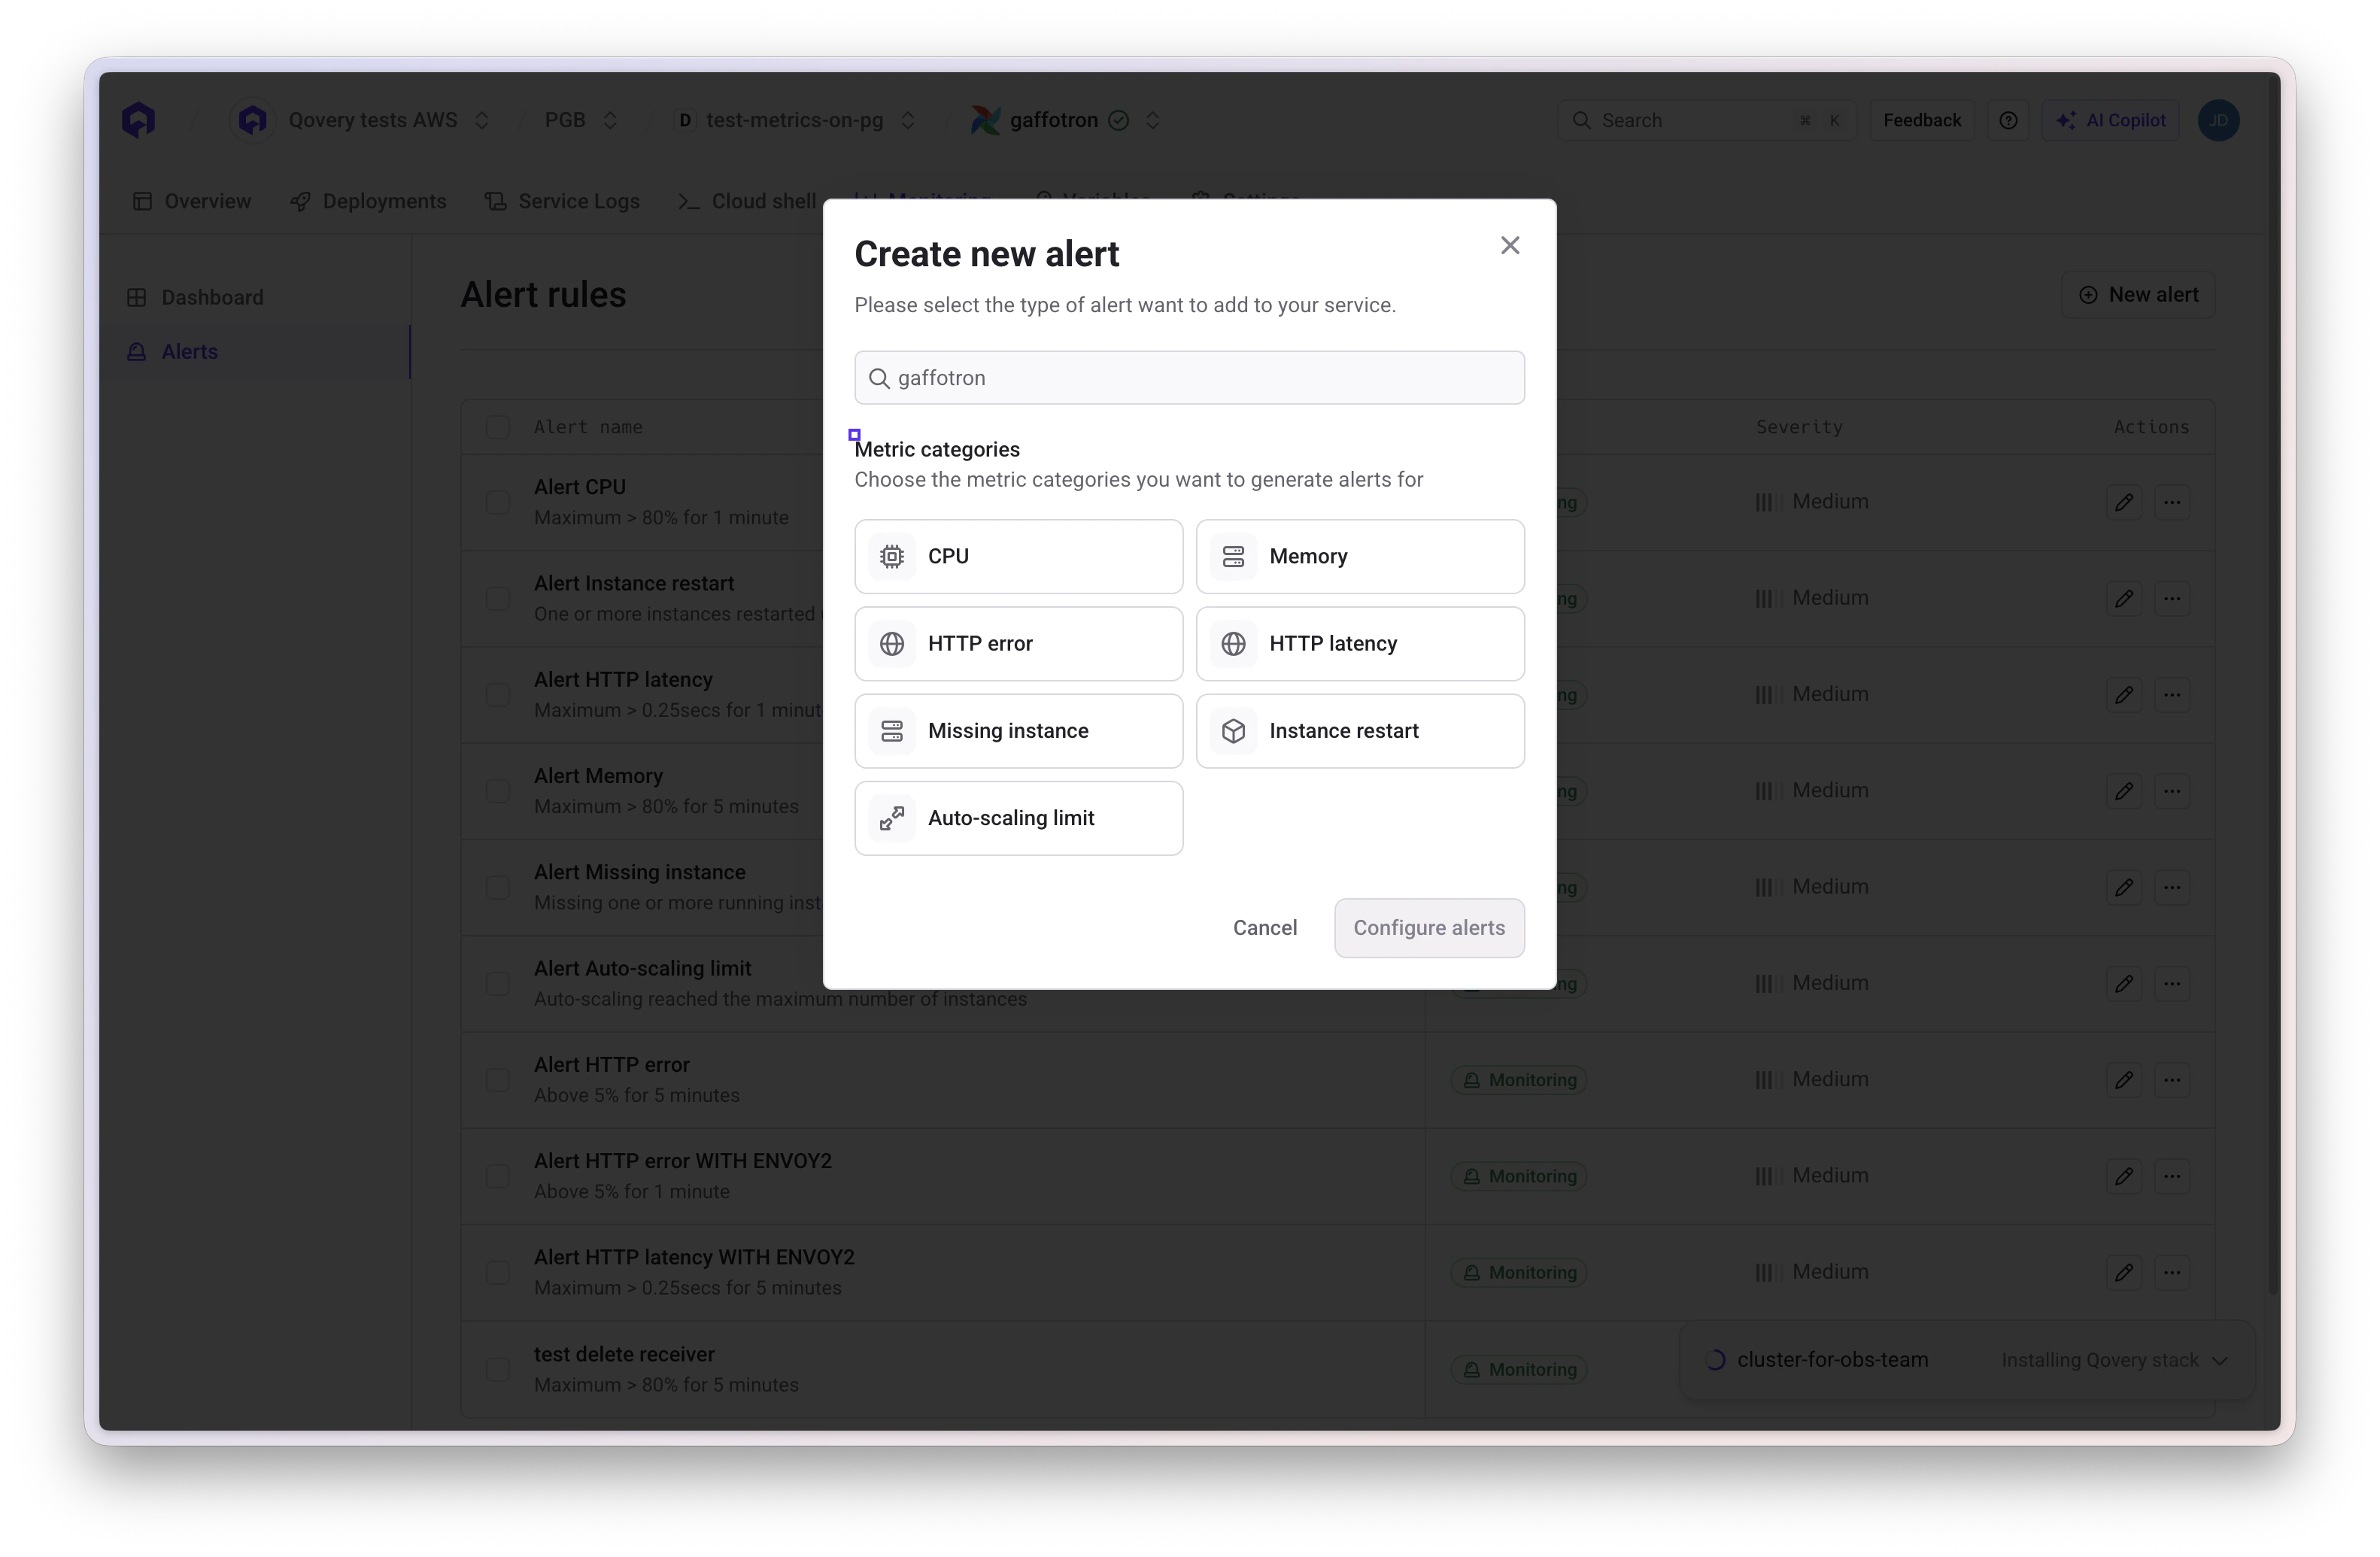 Start with pre-configured alert templates and adjust thresholds based on your service's normal behavior.
### Alert Conditions Guide
Understanding how to configure alert conditions is crucial for effective monitoring. Here's a detailed explanation of each configuration option.
#### Aggregation Methods (Maximum, Minimum, Average)
When monitoring metrics, you need to decide how to aggregate the data over the specified duration:
**When to use**: Detect peak usage or spikes
* **CPU**: Alert when any instance hits high CPU, even briefly
* **Memory**: Catch memory spikes before OOM kills
* **Network Latency**: Detect worst-case response times (tail latency)
**Example**: Alert when maximum CPU usage exceeds 80% - triggers if any pod reaches 80%, even if others are idle.
**When to use**: Detect drops or missing resources
* **CPU**: Identify underutilized services (cost optimization)
* **Memory**: Detect memory leaks causing gradual drops in available memory
* **Network Latency**: Ensure baseline performance (rarely used for latency)
**Example**: Alert when minimum running instances drops below 2 - triggers when you have fewer than 2 healthy pods.
**When to use**: Monitor overall service health
* **CPU**: Track average load across all instances
* **Memory**: Monitor typical memory consumption
* **Network Latency**: Measure average response time across requests
**Example**: Alert when average CPU usage exceeds 70% - triggers based on the mean CPU across all pods.
#### Trigger Conditions
Define when the alert should fire based on the comparison between your metric and threshold:
Triggers when metric **exceeds** the threshold
**Common use**: CPU usage, memory usage, 5xx error rates, latency
**Example**: CPU > 80%
Triggers when metric **falls below** the threshold
**Common use**: Available instances, request rate drops
**Example**: Running instances \< 2
Triggers when metric **exactly matches** the threshold
**Common use**: Specific status codes, exact counts
**Example**: Failed deployments = 3
Triggers when metric is **greater than or equal to** the threshold
**Common use**: Cumulative thresholds
**Example**: Error count ≥ 100
Triggers when metric is **less than or equal to** the threshold
**Common use**: Resource availability, uptime percentage
**Example**: Available memory ≤ 20%
#### Duration
The duration specifies how long the condition must be true before the alert fires. This prevents false positives from temporary spikes.
**Duration options:**
* **Last 1 minute**: Very sensitive, catches issues immediately but may have false positives
* **Last 5 minutes**: Balanced approach, good for most alerts
* **Last 10 minutes**: Conservative, reduces noise but may delay critical alerts
* **Last 15 minutes**: Best for informational alerts or gradual trends
Shorter durations increase alert sensitivity but also increase false positives. Longer durations reduce noise but may delay critical notifications.
Start with pre-configured alert templates and adjust thresholds based on your service's normal behavior.
### Alert Conditions Guide
Understanding how to configure alert conditions is crucial for effective monitoring. Here's a detailed explanation of each configuration option.
#### Aggregation Methods (Maximum, Minimum, Average)
When monitoring metrics, you need to decide how to aggregate the data over the specified duration:
**When to use**: Detect peak usage or spikes
* **CPU**: Alert when any instance hits high CPU, even briefly
* **Memory**: Catch memory spikes before OOM kills
* **Network Latency**: Detect worst-case response times (tail latency)
**Example**: Alert when maximum CPU usage exceeds 80% - triggers if any pod reaches 80%, even if others are idle.
**When to use**: Detect drops or missing resources
* **CPU**: Identify underutilized services (cost optimization)
* **Memory**: Detect memory leaks causing gradual drops in available memory
* **Network Latency**: Ensure baseline performance (rarely used for latency)
**Example**: Alert when minimum running instances drops below 2 - triggers when you have fewer than 2 healthy pods.
**When to use**: Monitor overall service health
* **CPU**: Track average load across all instances
* **Memory**: Monitor typical memory consumption
* **Network Latency**: Measure average response time across requests
**Example**: Alert when average CPU usage exceeds 70% - triggers based on the mean CPU across all pods.
#### Trigger Conditions
Define when the alert should fire based on the comparison between your metric and threshold:
Triggers when metric **exceeds** the threshold
**Common use**: CPU usage, memory usage, 5xx error rates, latency
**Example**: CPU > 80%
Triggers when metric **falls below** the threshold
**Common use**: Available instances, request rate drops
**Example**: Running instances \< 2
Triggers when metric **exactly matches** the threshold
**Common use**: Specific status codes, exact counts
**Example**: Failed deployments = 3
Triggers when metric is **greater than or equal to** the threshold
**Common use**: Cumulative thresholds
**Example**: Error count ≥ 100
Triggers when metric is **less than or equal to** the threshold
**Common use**: Resource availability, uptime percentage
**Example**: Available memory ≤ 20%
#### Duration
The duration specifies how long the condition must be true before the alert fires. This prevents false positives from temporary spikes.
**Duration options:**
* **Last 1 minute**: Very sensitive, catches issues immediately but may have false positives
* **Last 5 minutes**: Balanced approach, good for most alerts
* **Last 10 minutes**: Conservative, reduces noise but may delay critical alerts
* **Last 15 minutes**: Best for informational alerts or gradual trends
Shorter durations increase alert sensitivity but also increase false positives. Longer durations reduce noise but may delay critical notifications.
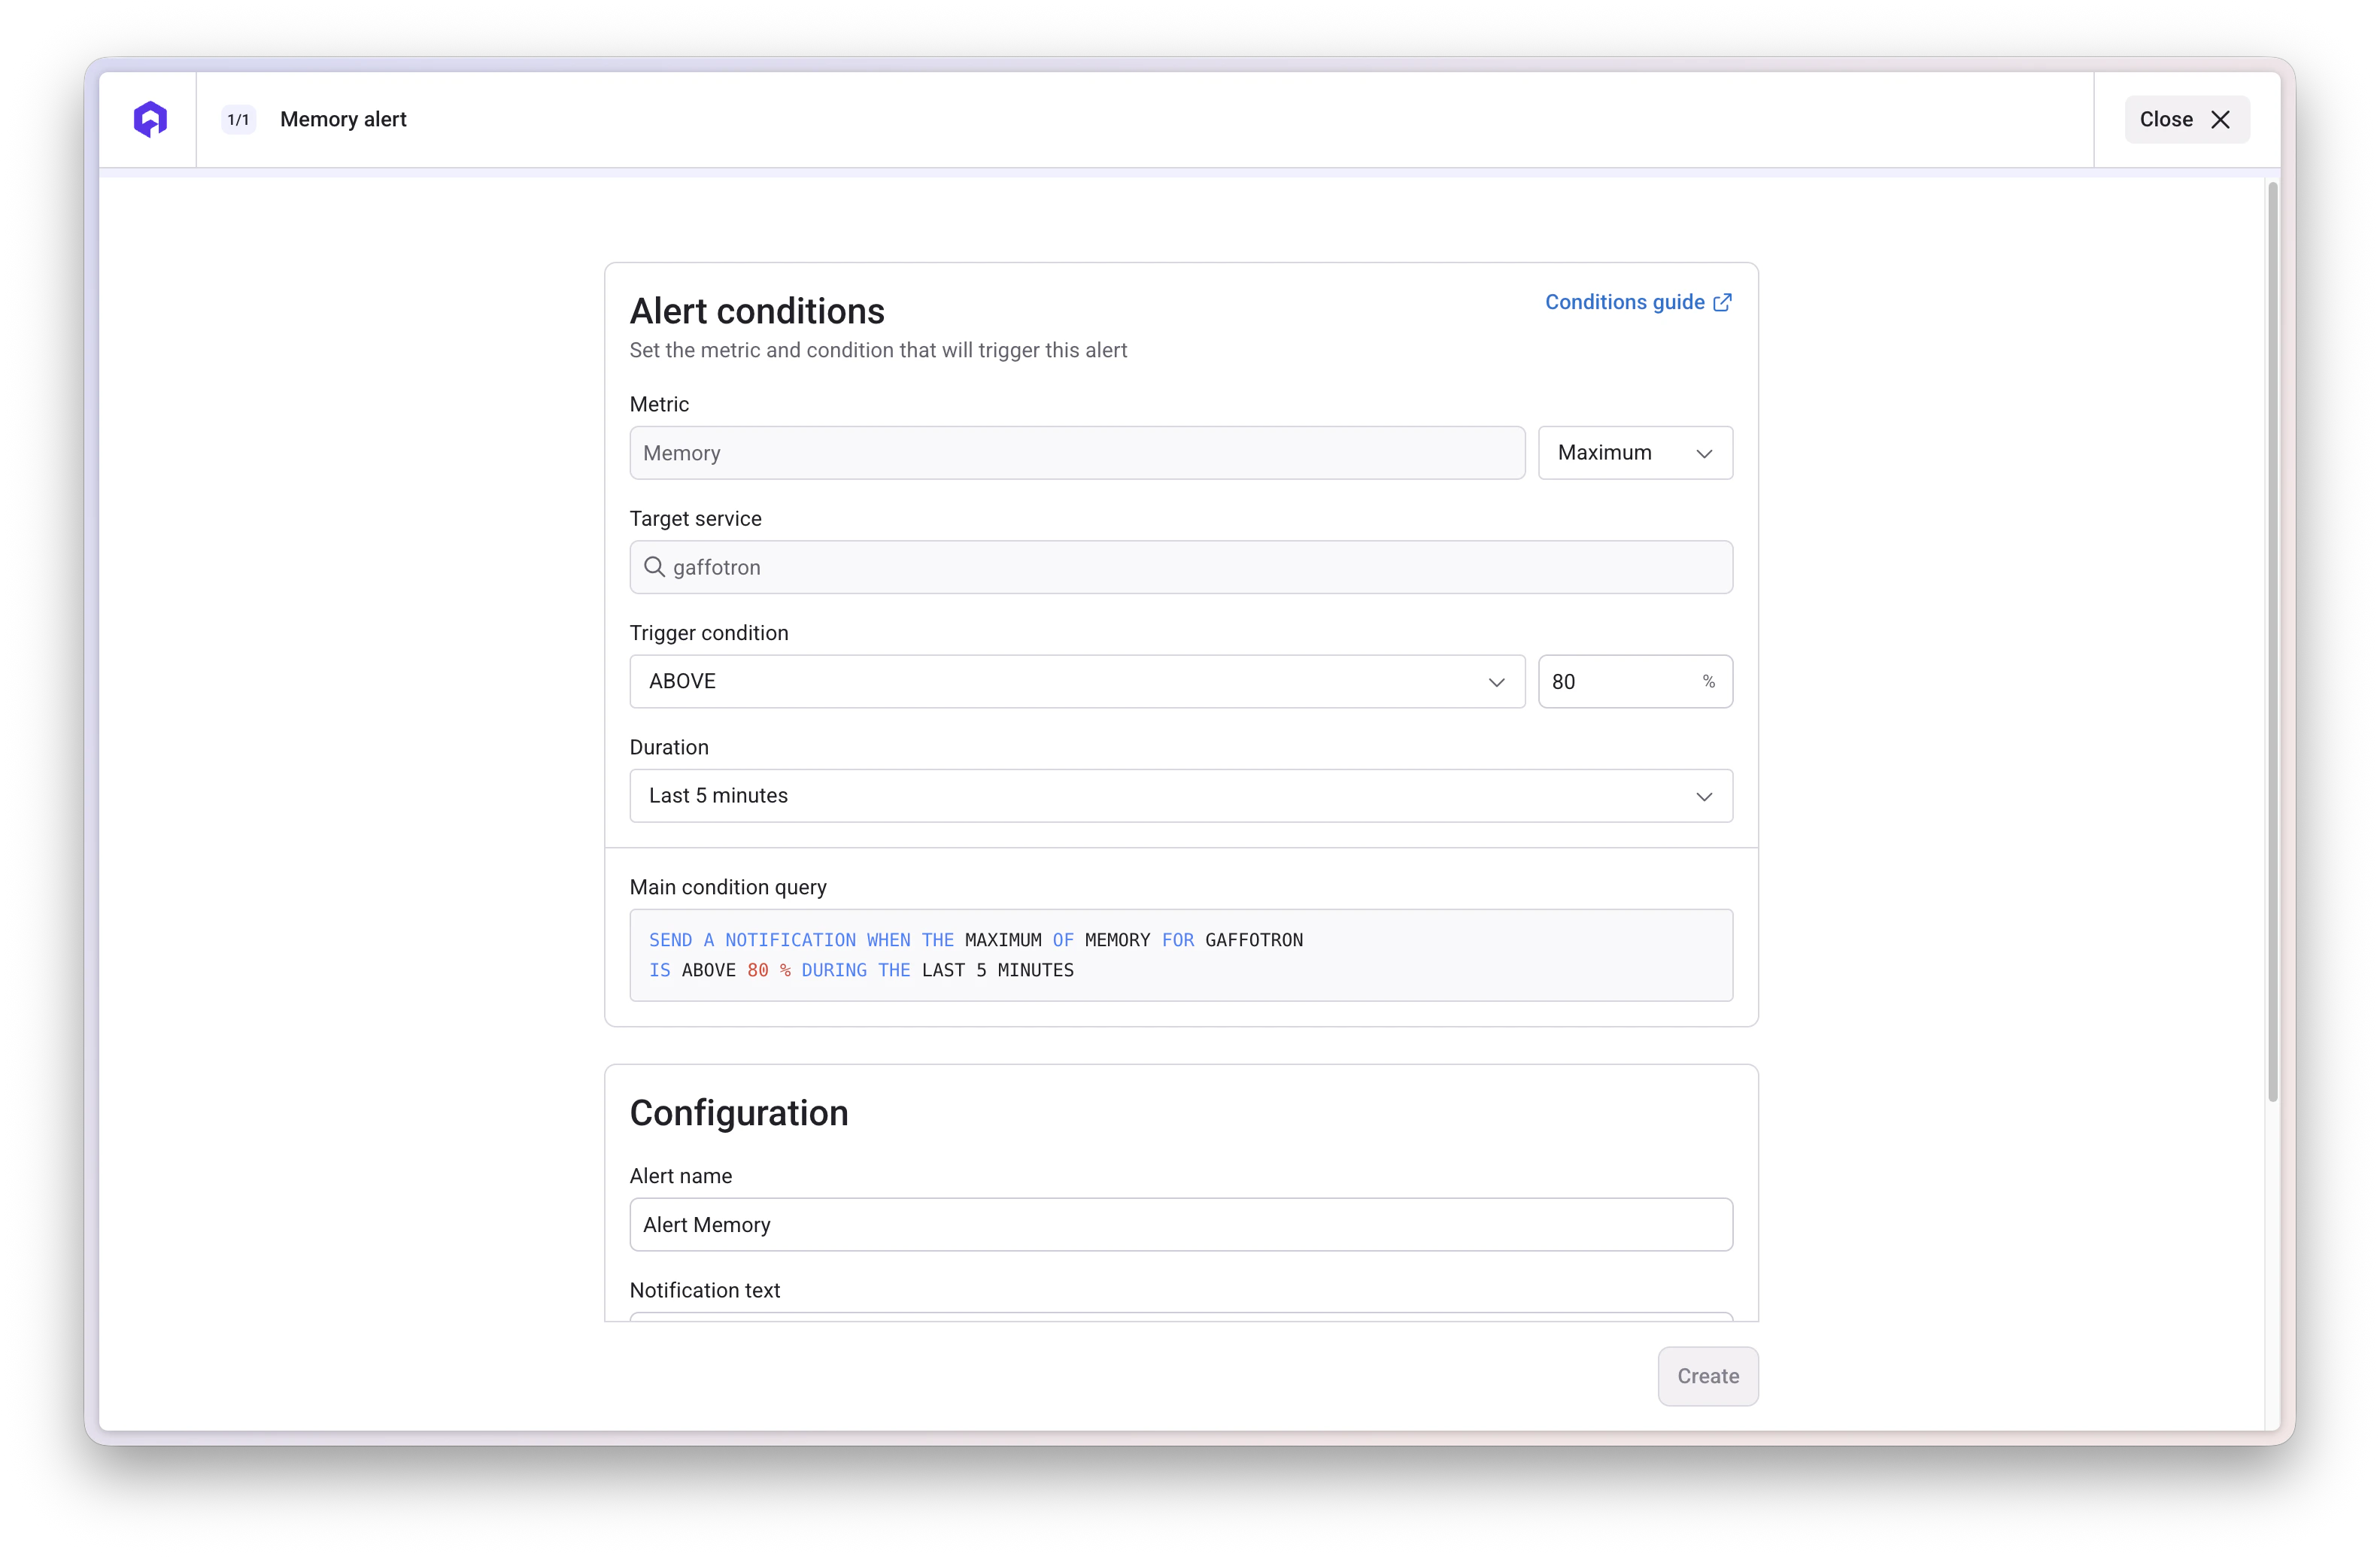 #### Practical Examples by Metric Type
**Recommended configuration:**
* **Aggregation**: Maximum (catches any pod spiking)
* **Trigger condition**: Above 80%
* **Duration**: Last 5 minutes
**Query example:**
```
SEND A NOTIFICATION WHEN THE MAXIMUM OF CPU
FOR [SERVICE_NAME] IS ABOVE 80 %
DURING THE LAST 5 MINUTES
```
**Why**: Maximum catches any pod hitting high CPU, 80% leaves headroom before throttling, 5 minutes filters temporary spikes.
**Recommended configuration:**
* **Aggregation**: Maximum (prevents OOM kills)
* **Trigger condition**: Above 85%
* **Duration**: Last 5 minutes
**Query example:**
```
SEND A NOTIFICATION WHEN THE MAXIMUM OF MEMORY
FOR [SERVICE_NAME] IS ABOVE 85 %
DURING THE LAST 5 MINUTES
```
**Why**: Maximum ensures no pod approaches OOM threshold, 85% provides buffer, 5 minutes allows time to investigate before critical.
**Recommended configuration:**
* **Aggregation**: Maximum (P99 latency)
* **Trigger condition**: Above 1000 ms
* **Duration**: Last 5 minutes
**Query example:**
```
SEND A NOTIFICATION WHEN THE MAXIMUM OF LATENCY (P99)
FOR [SERVICE_NAME] IS ABOVE 1000 MS
DURING THE LAST 5 MINUTES
```
**Why**: Maximum captures tail latency affecting user experience, 1000ms is a common SLA threshold, 5 minutes confirms sustained issue.
**Recommended configuration:**
* **Aggregation**: Average (across all requests)
* **Trigger condition**: Above 5%
* **Duration**: Last 3 minutes
**Query example:**
```
SEND A NOTIFICATION WHEN THE AVERAGE OF 5XX ERROR RATE
FOR [SERVICE_NAME] IS ABOVE 5 %
DURING THE LAST 3 MINUTES
```
**Why**: Average 5xx error rate shows server-side issues, 5% indicates significant problems, 3 minutes for faster detection of service degradation.
Use the **Main condition query** preview to verify your alert configuration before saving. The query shows exactly what condition will trigger notifications.
## Next Steps
Set up Slack notification channels for alerts
Set up email notification channels for alerts
Add Datadog for advanced monitoring
Monitor and reduce Kubernetes costs
View deployment and service logs
Configure health checks and ports
#### Practical Examples by Metric Type
**Recommended configuration:**
* **Aggregation**: Maximum (catches any pod spiking)
* **Trigger condition**: Above 80%
* **Duration**: Last 5 minutes
**Query example:**
```
SEND A NOTIFICATION WHEN THE MAXIMUM OF CPU
FOR [SERVICE_NAME] IS ABOVE 80 %
DURING THE LAST 5 MINUTES
```
**Why**: Maximum catches any pod hitting high CPU, 80% leaves headroom before throttling, 5 minutes filters temporary spikes.
**Recommended configuration:**
* **Aggregation**: Maximum (prevents OOM kills)
* **Trigger condition**: Above 85%
* **Duration**: Last 5 minutes
**Query example:**
```
SEND A NOTIFICATION WHEN THE MAXIMUM OF MEMORY
FOR [SERVICE_NAME] IS ABOVE 85 %
DURING THE LAST 5 MINUTES
```
**Why**: Maximum ensures no pod approaches OOM threshold, 85% provides buffer, 5 minutes allows time to investigate before critical.
**Recommended configuration:**
* **Aggregation**: Maximum (P99 latency)
* **Trigger condition**: Above 1000 ms
* **Duration**: Last 5 minutes
**Query example:**
```
SEND A NOTIFICATION WHEN THE MAXIMUM OF LATENCY (P99)
FOR [SERVICE_NAME] IS ABOVE 1000 MS
DURING THE LAST 5 MINUTES
```
**Why**: Maximum captures tail latency affecting user experience, 1000ms is a common SLA threshold, 5 minutes confirms sustained issue.
**Recommended configuration:**
* **Aggregation**: Average (across all requests)
* **Trigger condition**: Above 5%
* **Duration**: Last 3 minutes
**Query example:**
```
SEND A NOTIFICATION WHEN THE AVERAGE OF 5XX ERROR RATE
FOR [SERVICE_NAME] IS ABOVE 5 %
DURING THE LAST 3 MINUTES
```
**Why**: Average 5xx error rate shows server-side issues, 5% indicates significant problems, 3 minutes for faster detection of service degradation.
Use the **Main condition query** preview to verify your alert configuration before saving. The query shows exactly what condition will trigger notifications.
## Next Steps
Set up Slack notification channels for alerts
Set up email notification channels for alerts
Add Datadog for advanced monitoring
Monitor and reduce Kubernetes costs
View deployment and service logs
Configure health checks and ports