> ## Documentation Index
> Fetch the complete documentation index at: https://www.qovery.com/docs/llms.txt
> Use this file to discover all available pages before exploring further.
# Logs
> Access deployment and service logs
Qovery provides you with the logs of your deployments and services through the Qovery Console.
## Two Types of Logs
Qovery provides you with two types of logs:
1. **Deployment logs**: Every time a deployment is triggered, Qovery provides you with the log of its execution and the errors if any
2. **Service logs**: Real-time logs of your application streamed directly from your application (not stored on Qovery's infrastructure)
## How to Access Logs
You can access logs from three different entry points in the Qovery Console:
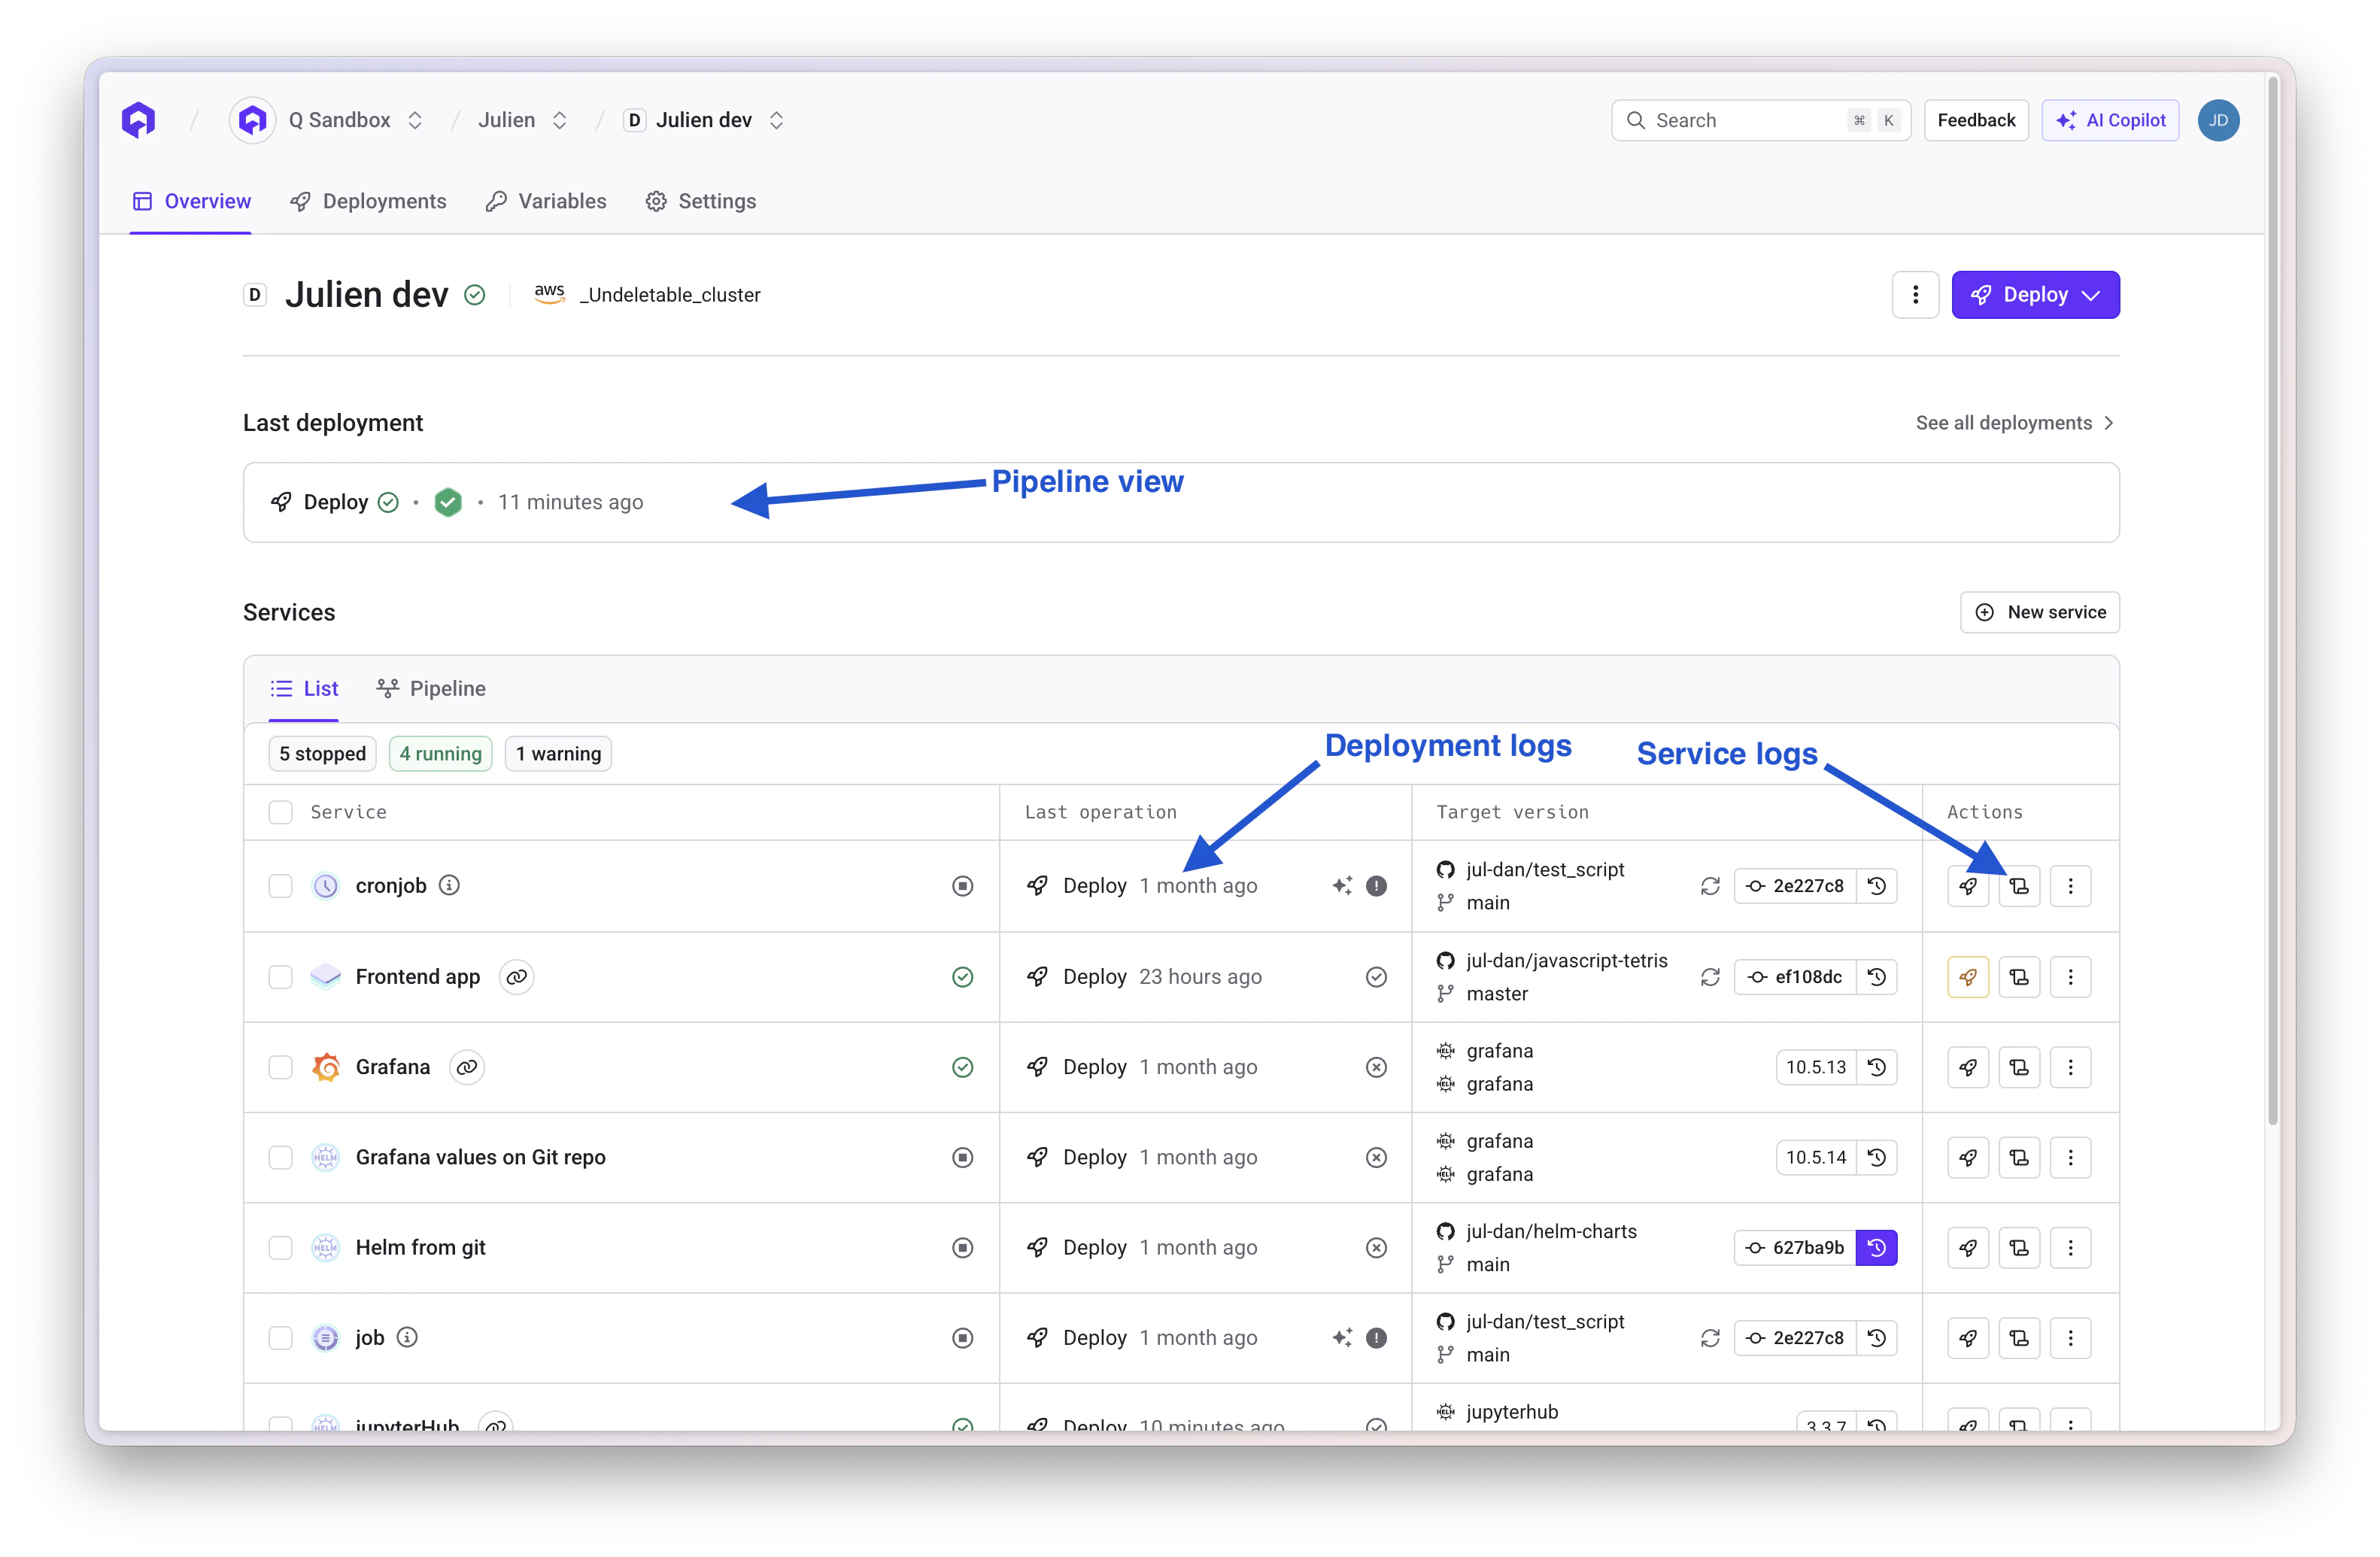 1. **Scroll icon** next to the service: Access the service logs (runtime logs from your application)
2. **Last Deployment section**: Access the deployment pipeline view showing all stages of the deployment
3. **Deployment status label**: Access the deployment logs for a specific deployment
## Pipeline View
The pipeline view provides a centralized overview of your deployment process, showing all deployment stages including pre-check validations.
1. **Scroll icon** next to the service: Access the service logs (runtime logs from your application)
2. **Last Deployment section**: Access the deployment pipeline view showing all stages of the deployment
3. **Deployment status label**: Access the deployment logs for a specific deployment
## Pipeline View
The pipeline view provides a centralized overview of your deployment process, showing all deployment stages including pre-check validations.
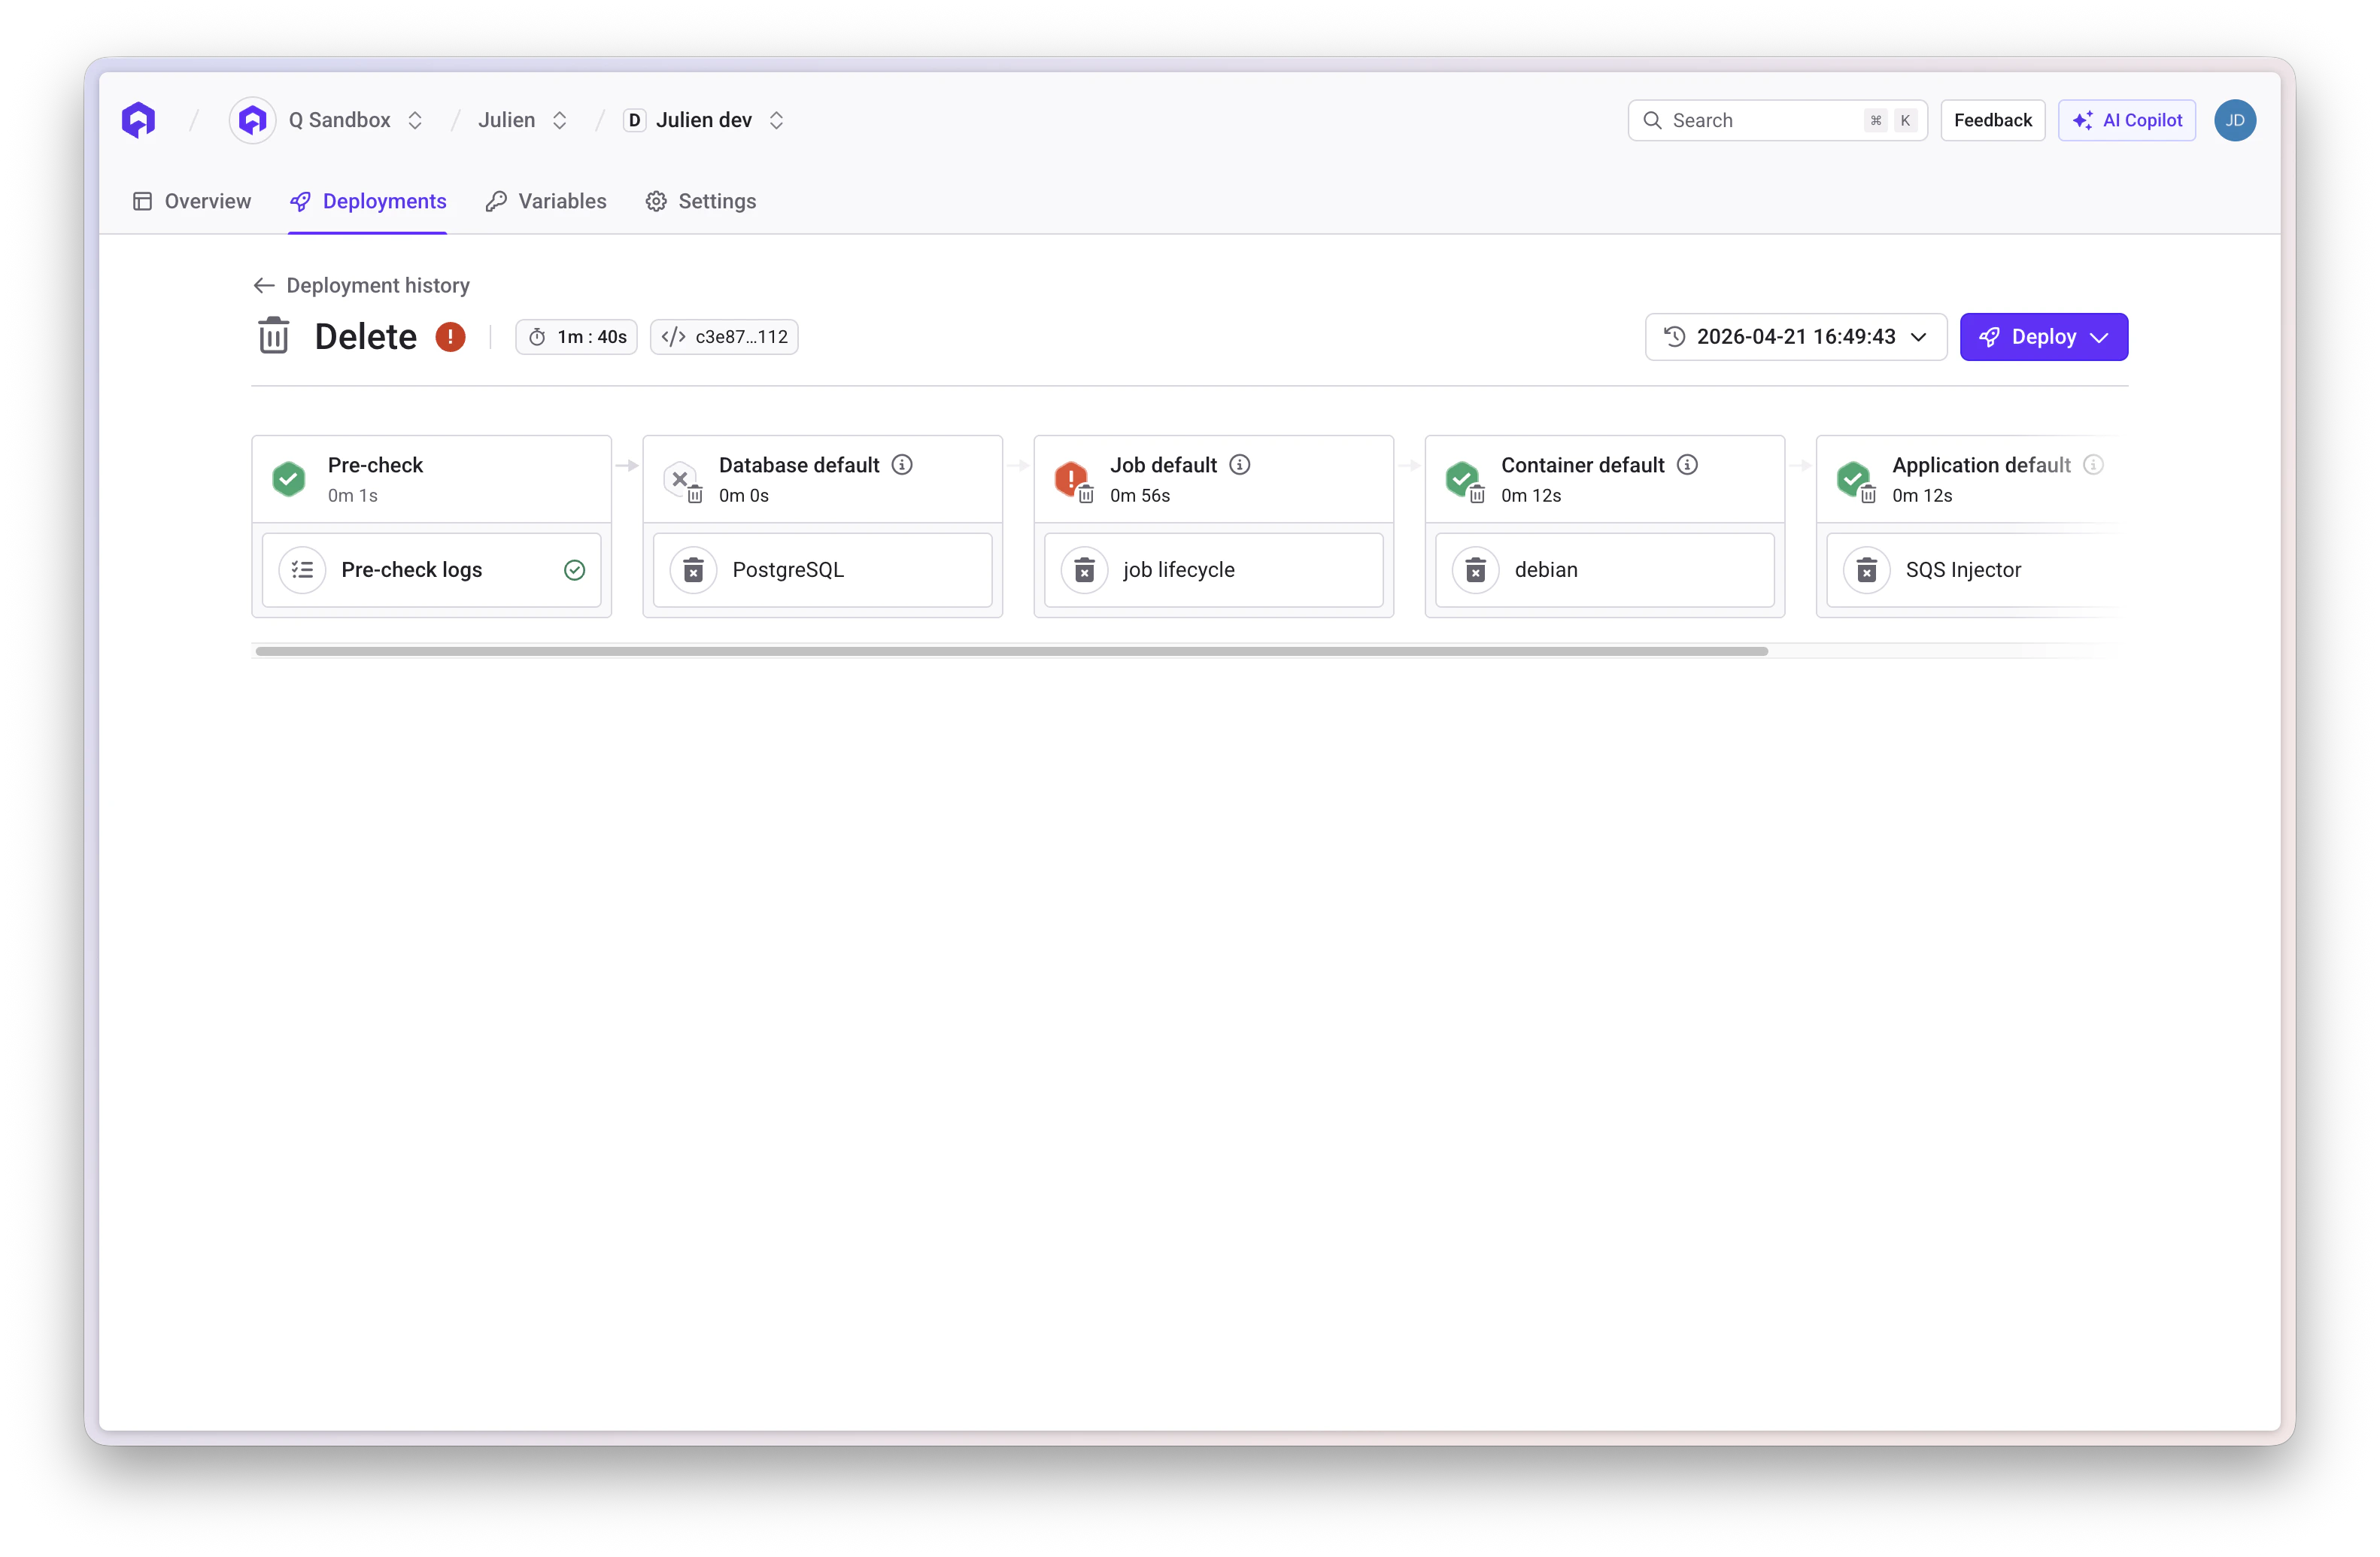 **Features:**
* Stage-by-stage visibility of deployment phases
* Pre-check logs for validation processes
* Direct access to specific deployment logs per service
* Automatic filtering of services not involved in the deployment
## Pre-Check Logs
Before sending work to the deployment engine, Qovery runs a **pre-check stage** that validates a set of preconditions. If any check fails, the deployment is stopped immediately — before any infrastructure change is made.
### What Pre-Checks Validate
Pre-checks cover three areas:
**1. Cloud provider credentials**
Verifies that the credentials configured on the cluster are still valid and have the necessary permissions (AWS IAM role/static keys, GCP service account, Azure app registration, Scaleway secret key).
**2. Git repository access**
For services built from Git (applications, jobs, Helm charts):
* The configured **root path** exists in the repository at the target commit
* For Helm values files, the **file path** exists
* The **Dockerfile** (if any) exists and contains a valid `FROM` directive
* The repository **owner's git credentials** are still valid
**3. Repository size**
Rejects repositories exceeding **5 GB**.
### How to Access Pre-Check Logs
1. Open the **Last Deployment** section or go to the **Deployment History** tab
2. Click on a deployment to open the pipeline view
3. Click the **pre-check stage** — the logs stream the full output including error messages and hints
### When Pre-Checks Fail
The error message in the logs identifies exactly what failed (e.g. invalid credentials, missing path, oversized repo). Fix the reported issue and trigger a new deployment.
Pre-check failures are not deployment failures — no rollback is needed because no infrastructure changes were applied.
## Deployment Logs
By default, the deployment logs view shows the most recent deployment execution.
**Features:**
* Stage-by-stage visibility of deployment phases
* Pre-check logs for validation processes
* Direct access to specific deployment logs per service
* Automatic filtering of services not involved in the deployment
## Pre-Check Logs
Before sending work to the deployment engine, Qovery runs a **pre-check stage** that validates a set of preconditions. If any check fails, the deployment is stopped immediately — before any infrastructure change is made.
### What Pre-Checks Validate
Pre-checks cover three areas:
**1. Cloud provider credentials**
Verifies that the credentials configured on the cluster are still valid and have the necessary permissions (AWS IAM role/static keys, GCP service account, Azure app registration, Scaleway secret key).
**2. Git repository access**
For services built from Git (applications, jobs, Helm charts):
* The configured **root path** exists in the repository at the target commit
* For Helm values files, the **file path** exists
* The **Dockerfile** (if any) exists and contains a valid `FROM` directive
* The repository **owner's git credentials** are still valid
**3. Repository size**
Rejects repositories exceeding **5 GB**.
### How to Access Pre-Check Logs
1. Open the **Last Deployment** section or go to the **Deployment History** tab
2. Click on a deployment to open the pipeline view
3. Click the **pre-check stage** — the logs stream the full output including error messages and hints
### When Pre-Checks Fail
The error message in the logs identifies exactly what failed (e.g. invalid credentials, missing path, oversized repo). Fix the reported issue and trigger a new deployment.
Pre-check failures are not deployment failures — no rollback is needed because no infrastructure changes were applied.
## Deployment Logs
By default, the deployment logs view shows the most recent deployment execution.
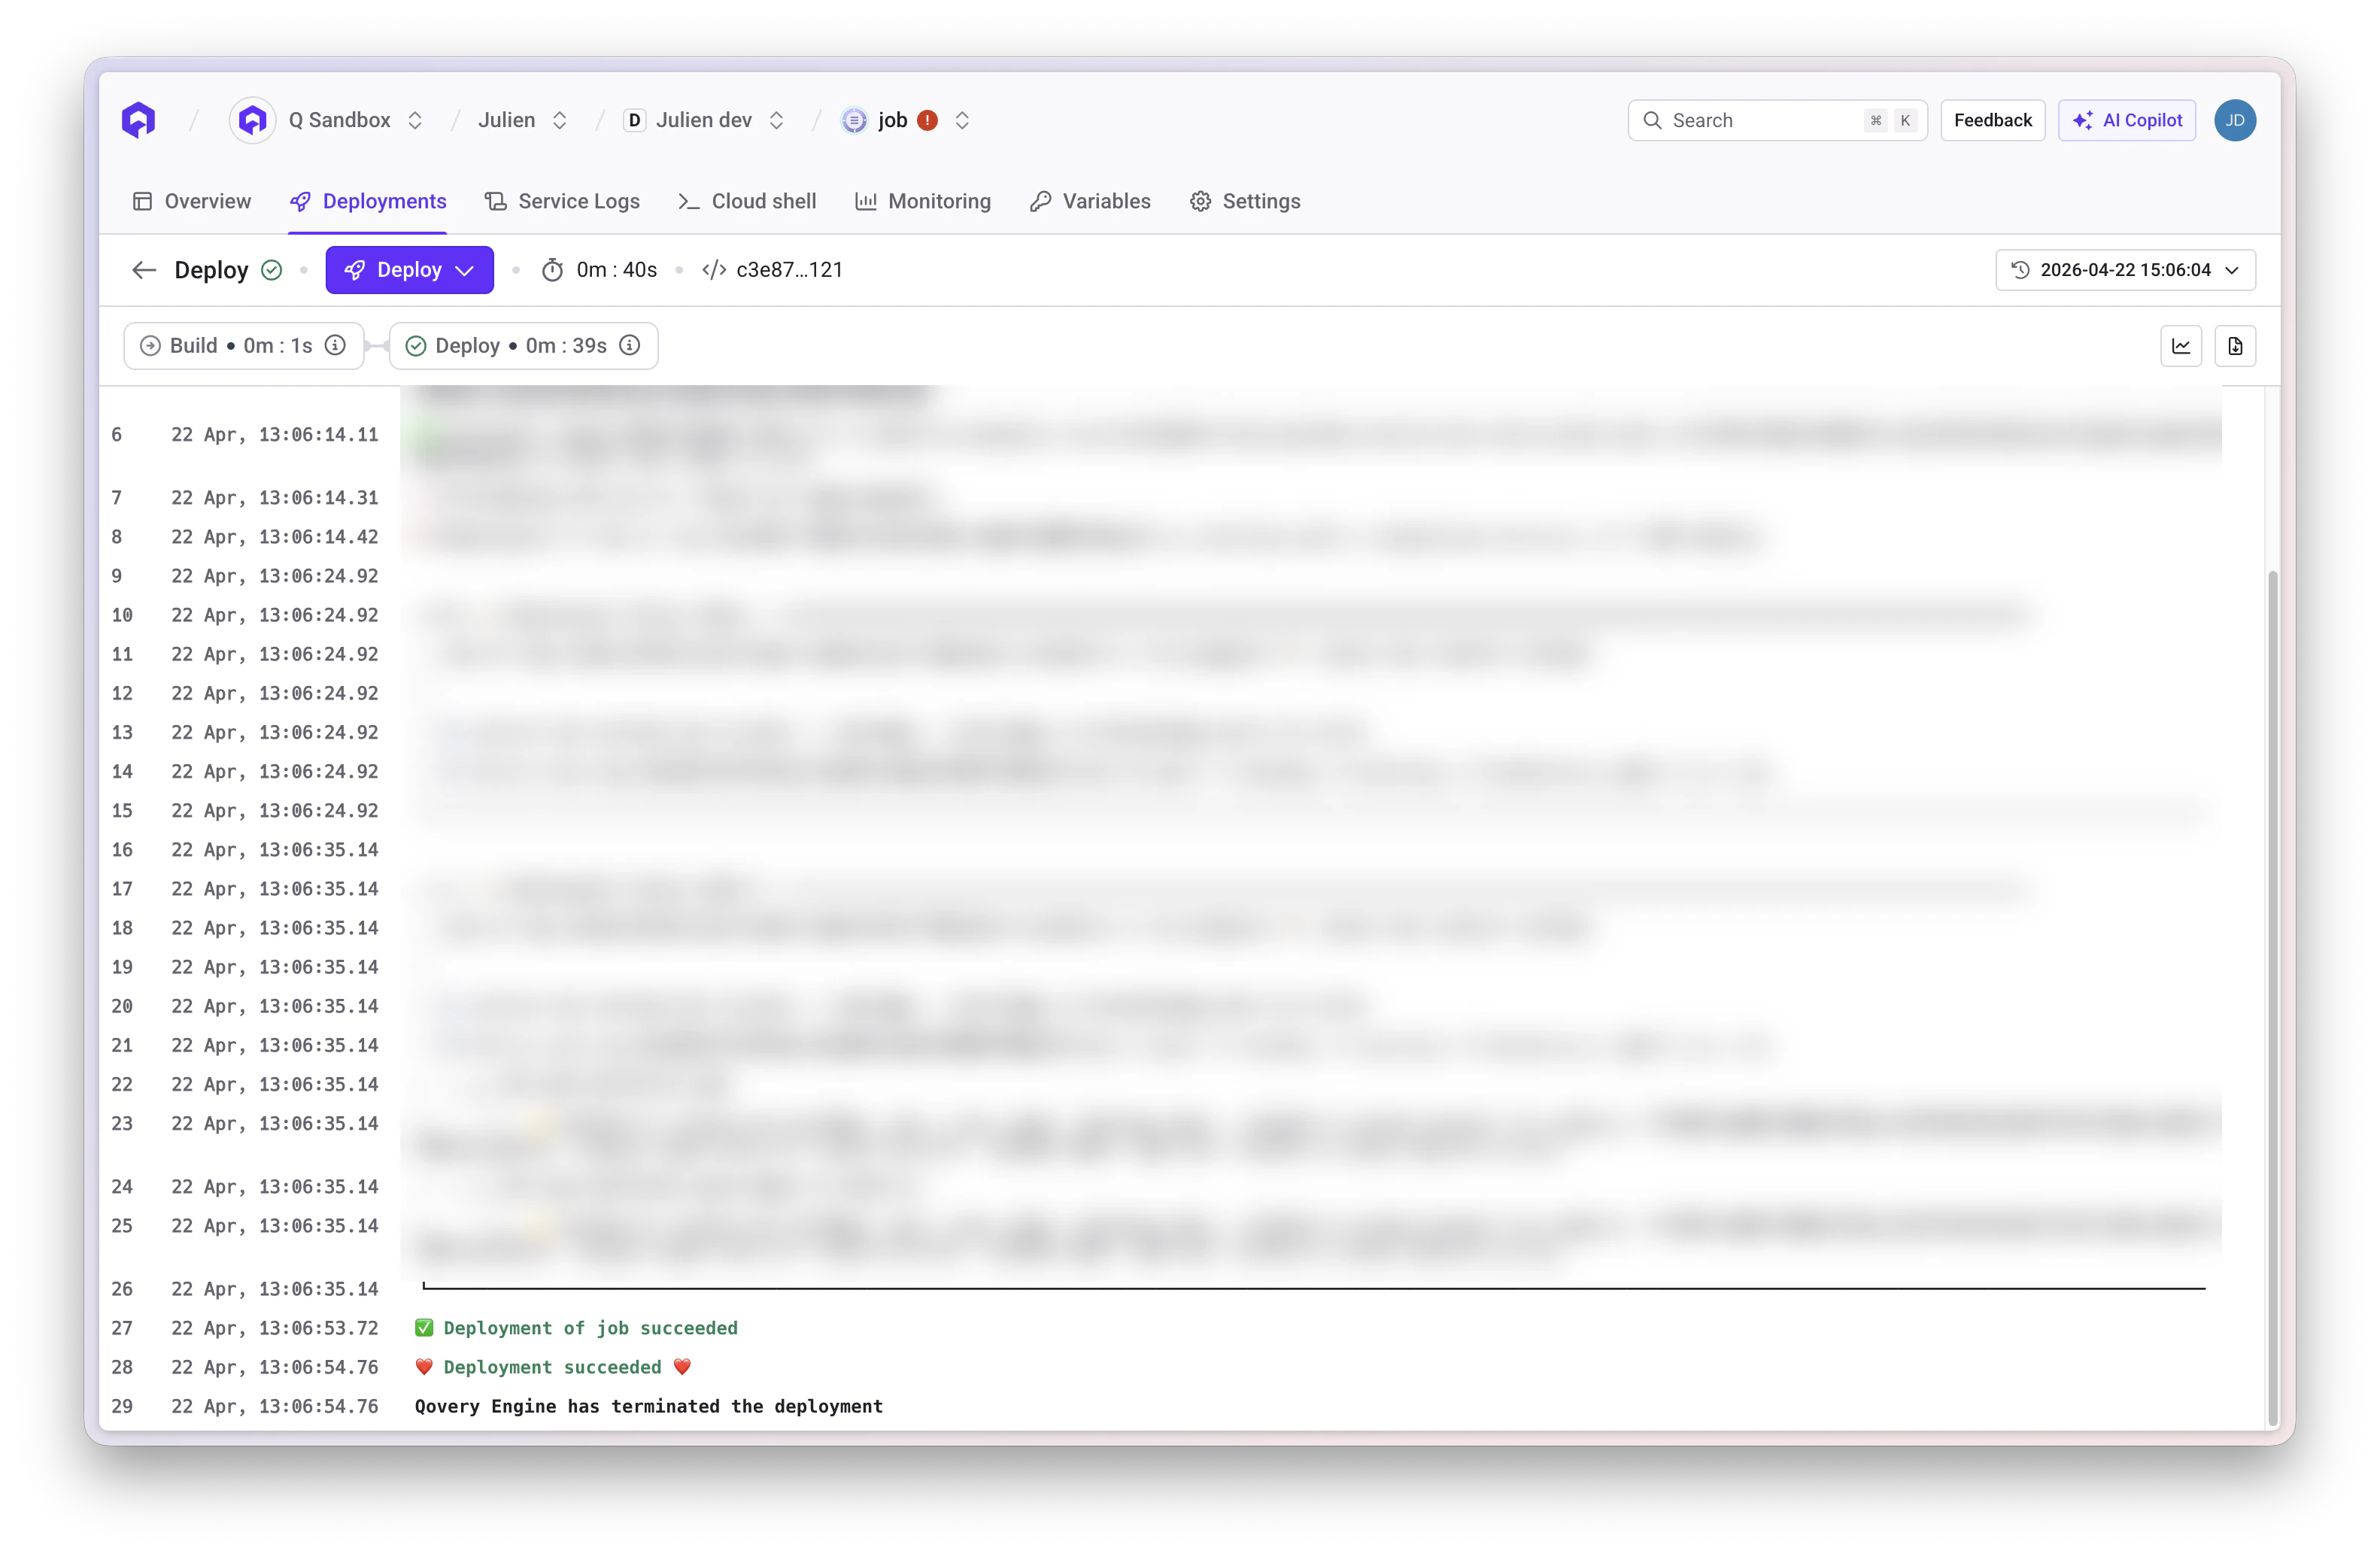 **What's included:**
* Build logs when Qovery CI pipeline builds your service
* Deployment status updates during Kubernetes execution
* Final success/failure confirmation with issue guidance
### Build Runner Usage
For services that include a build step (applications and jobs with a git source), a **Build runner usage** button appears in the deployment logs header alongside "Go to pipeline" and "Go to service logs".
Clicking this button generates a temporary Grafana snapshot showing build pod resource usage (CPU, memory, network I/O) and opens it in a new tab. The link is publicly accessible and expires after **1 hour**.
The snapshot covers from build start to \~40 minutes after, scoped to the specific build pod. This helps identify resource-constrained builds and right-size build infrastructure.
This button is only visible for services with a build step. It does not appear for services deployed from a pre-built container image.
You can access historical deployments through the "Deployment log switch" or the Deployment history tab.
**What's included:**
* Build logs when Qovery CI pipeline builds your service
* Deployment status updates during Kubernetes execution
* Final success/failure confirmation with issue guidance
### Build Runner Usage
For services that include a build step (applications and jobs with a git source), a **Build runner usage** button appears in the deployment logs header alongside "Go to pipeline" and "Go to service logs".
Clicking this button generates a temporary Grafana snapshot showing build pod resource usage (CPU, memory, network I/O) and opens it in a new tab. The link is publicly accessible and expires after **1 hour**.
The snapshot covers from build start to \~40 minutes after, scoped to the specific build pod. This helps identify resource-constrained builds and right-size build infrastructure.
This button is only visible for services with a build step. It does not appear for services deployed from a pre-built container image.
You can access historical deployments through the "Deployment log switch" or the Deployment history tab.
 Qovery retains logs for **the last 20 deployments executed** plus the latest failure.
## Service Logs (Live Logs)
Real-time application logs are streamed directly from your running applications.
Qovery retains logs for **the last 20 deployments executed** plus the latest failure.
## Service Logs (Live Logs)
Real-time application logs are streamed directly from your running applications.
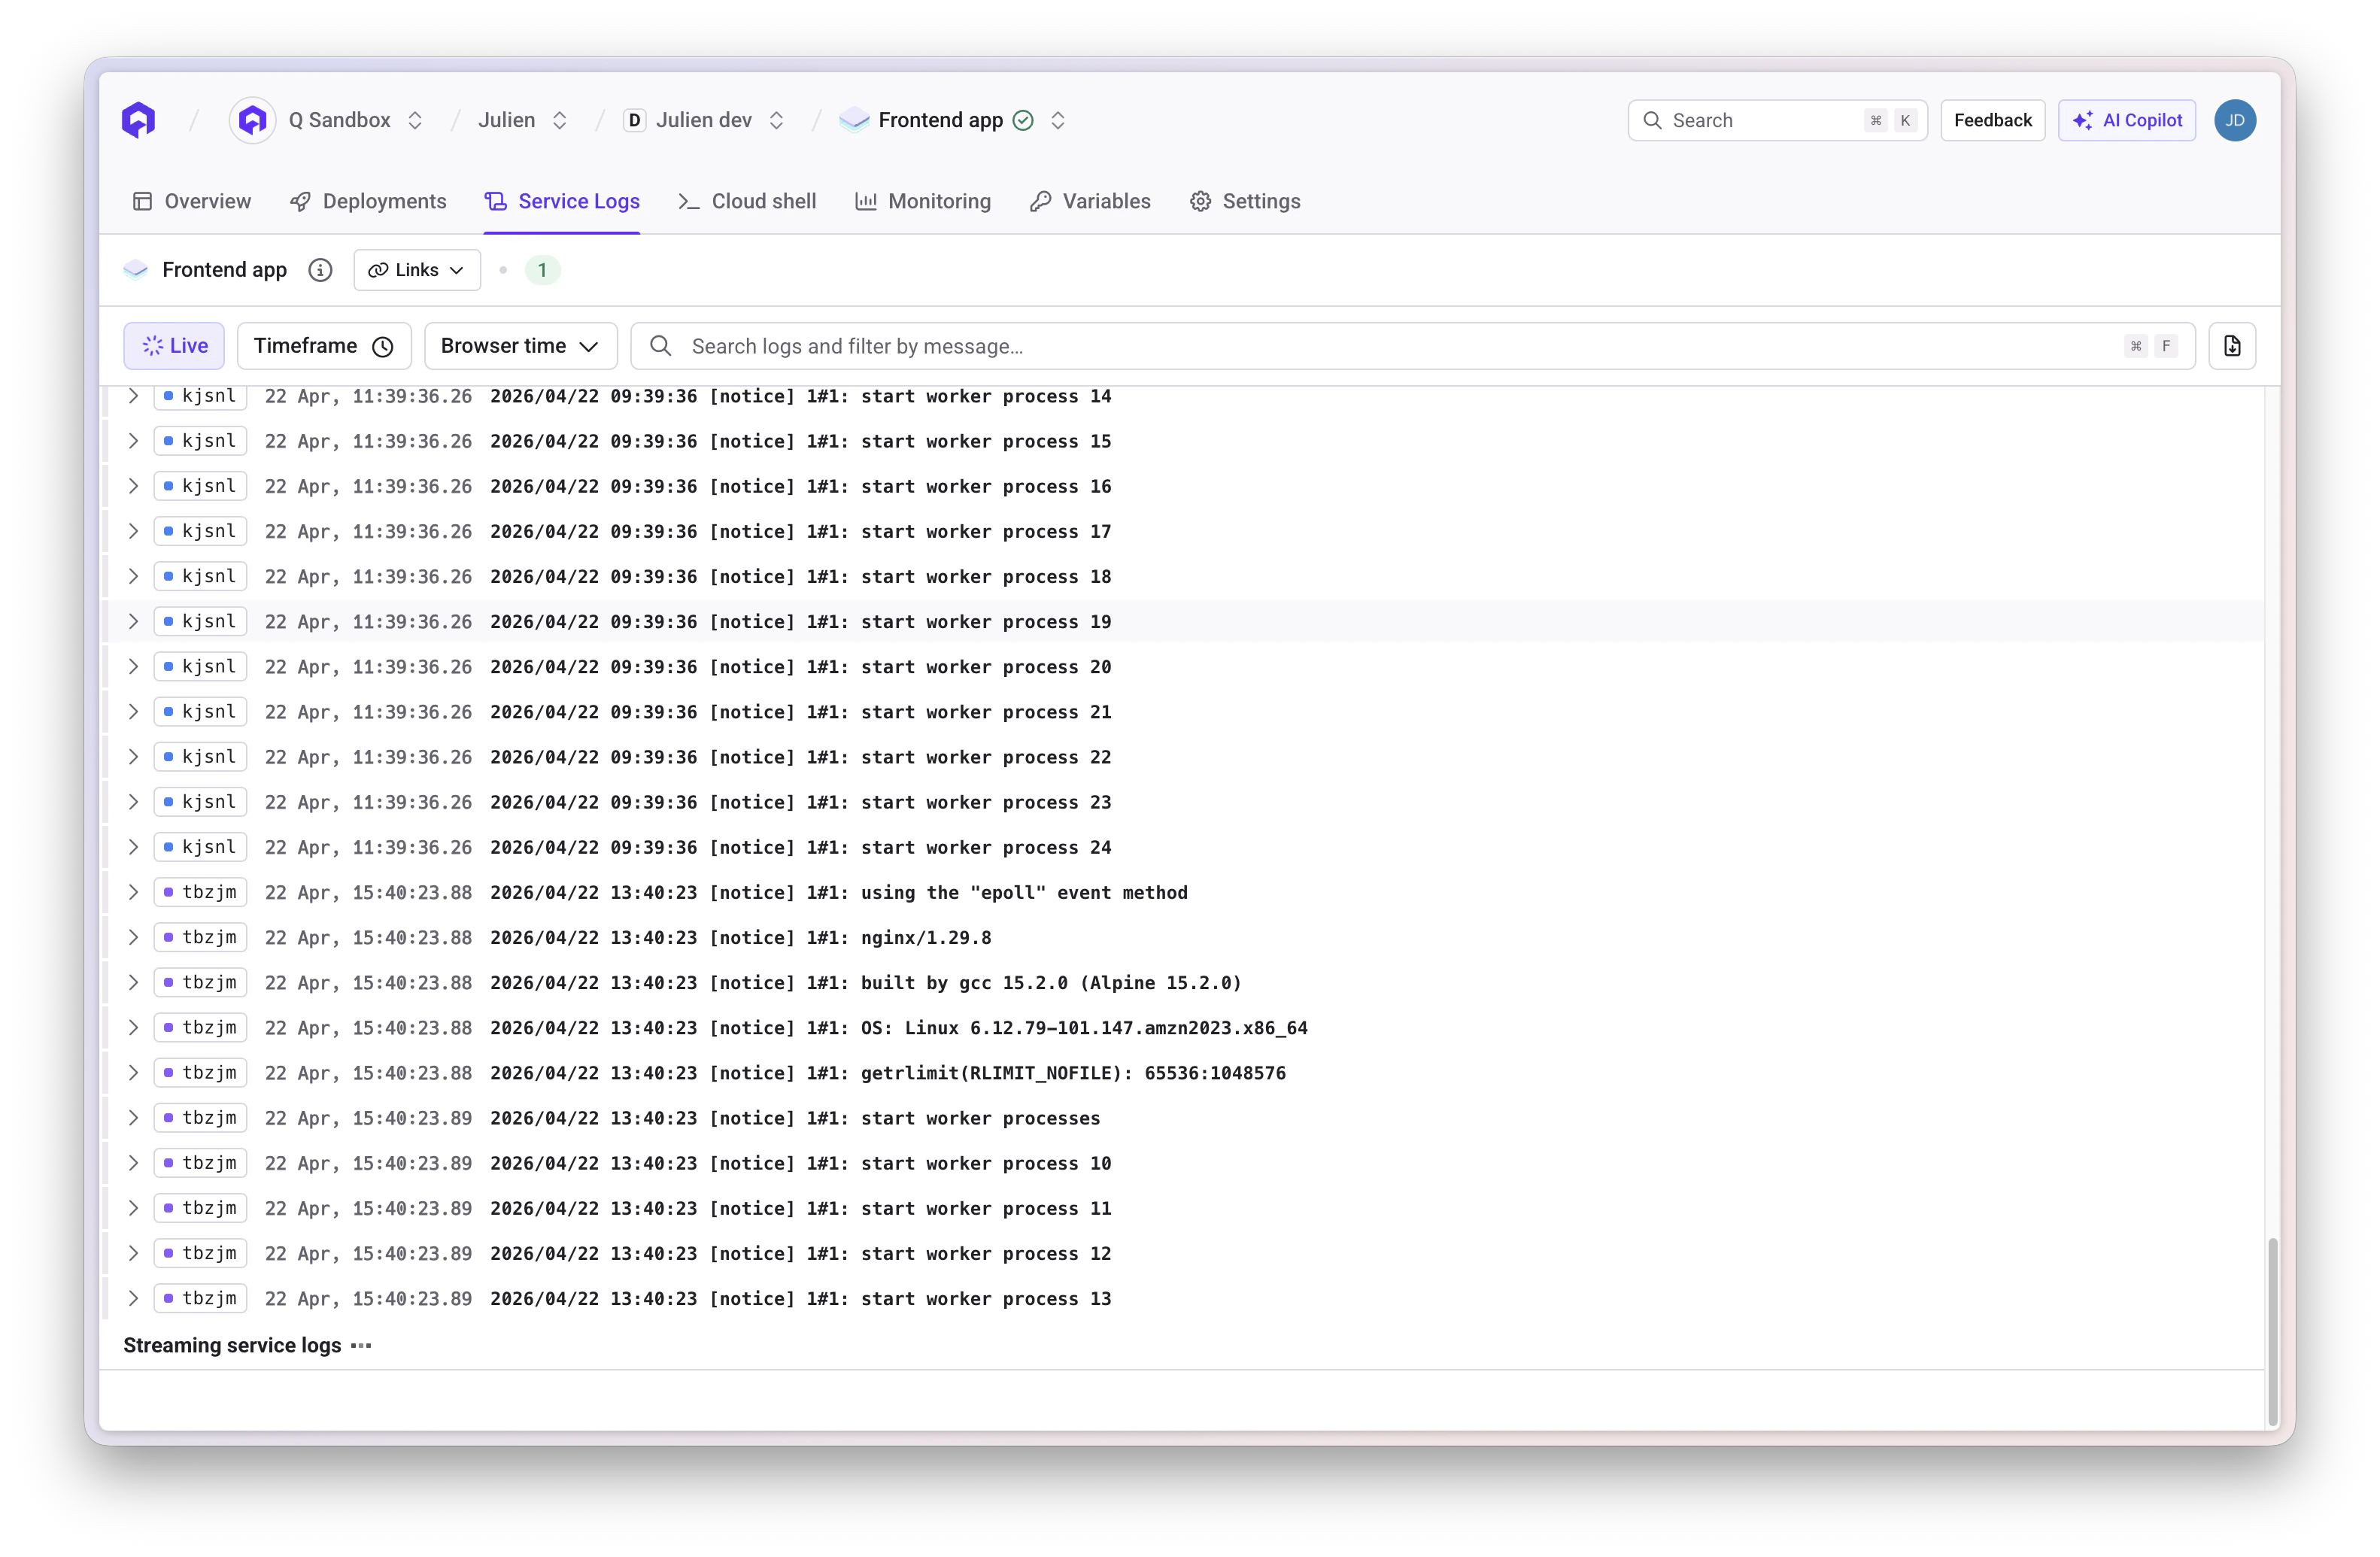 Each log entry displays:
* **Timestamp**: When the log was generated
* **Pod name**: Which instance generated the log (filterable for multi-instance applications)
* **Version**: Commit ID or image tag
* **Container**: Container name
* **Message**: The actual log content
### Filtering Logs
Each log entry displays:
* **Timestamp**: When the log was generated
* **Pod name**: Which instance generated the log (filterable for multi-instance applications)
* **Version**: Commit ID or image tag
* **Container**: Container name
* **Message**: The actual log content
### Filtering Logs
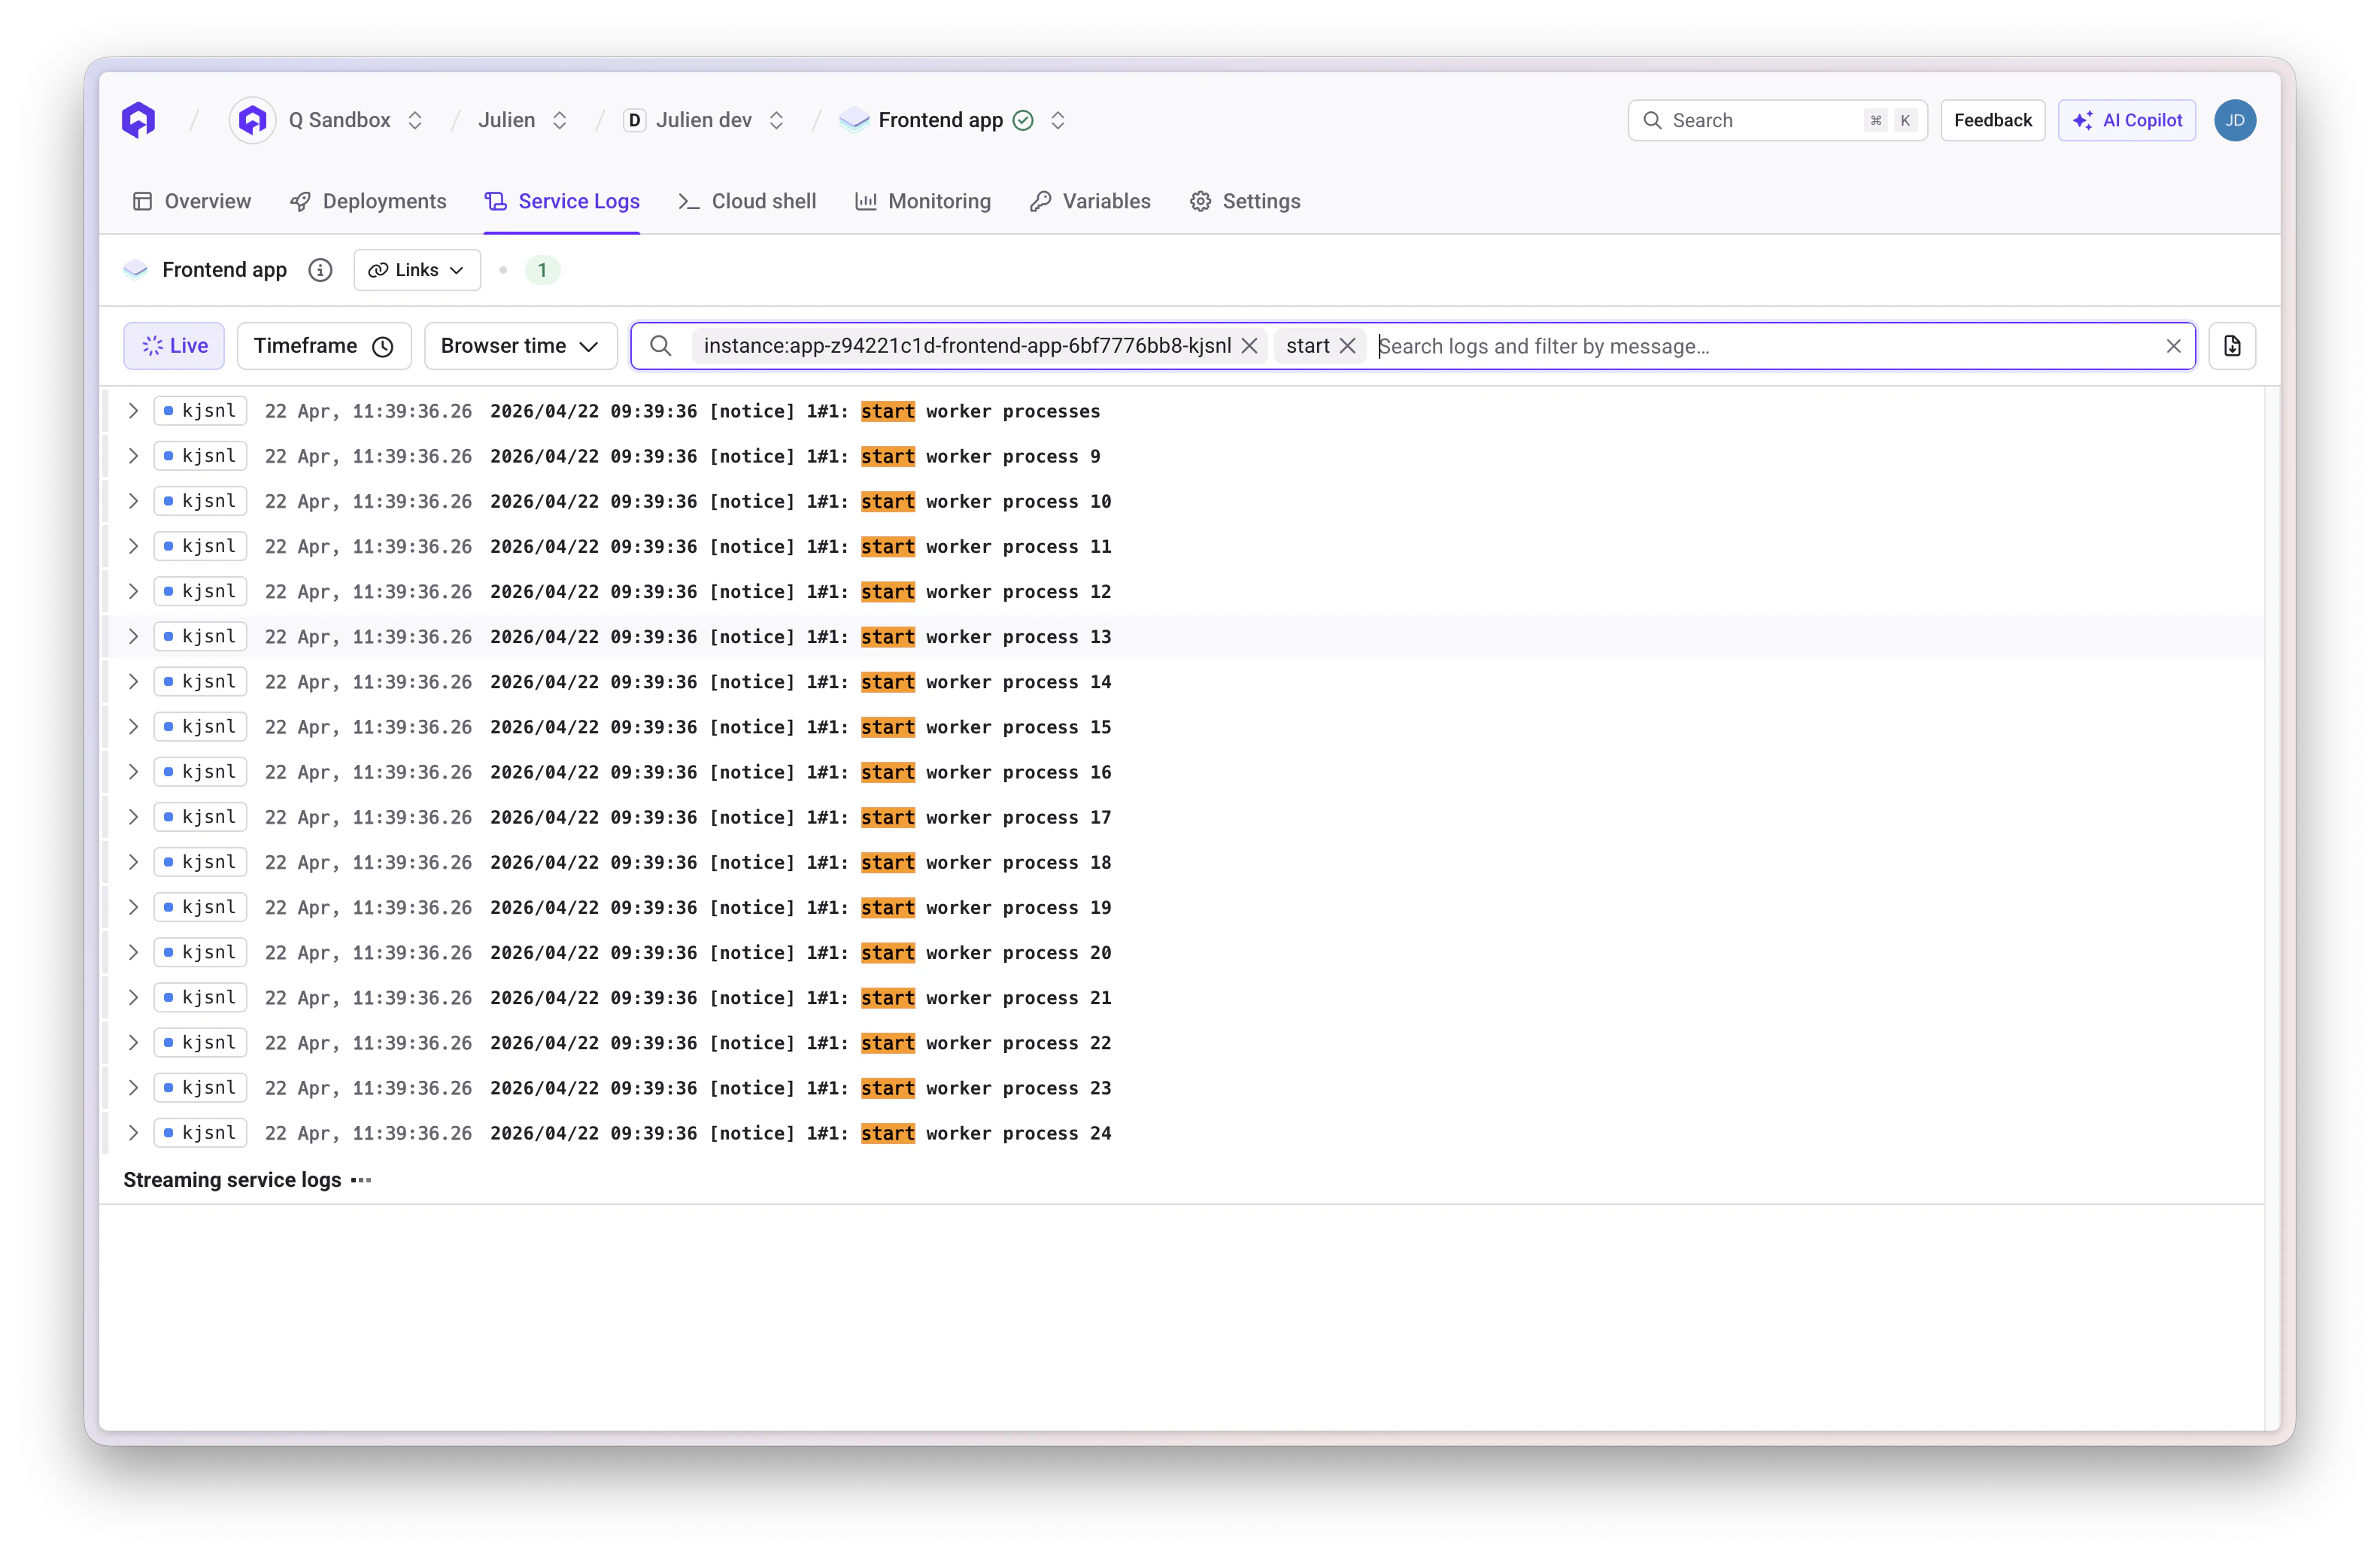 You can filter logs using:
* **Search by keyword**: Locate specific messages
* **Filter by time range**: Isolate specific periods
* **Filter by log level**: Prioritize by severity
* **Filter by pod**: View logs from specific instances
* **Filter by deployment ID**: Isolate logs from a specific deployment
#### Filter by Deployment ID
When troubleshooting a failed deployment, you can filter logs using the `deployment_id` to see only the logs produced during that specific deployment. This removes noise from other deployments and helps you get to the root cause faster.
To use this feature:
1. Navigate to the deployment history and find the deployment ID you want to investigate
2. Apply the deployment ID filter in the logs view
3. Review only the logs generated during that specific deployment's bootstrap process
When viewing deployment logs, clicking "Go to service logs" automatically applies the deployment ID filter, seamlessly transitioning you from deployment logs to the filtered service logs for that specific deployment.
This is especially useful when:
* A deployment fails during application startup
* You need to isolate issues from a specific deployment attempt
* Multiple deployments have occurred and you want to focus on one particular execution
## Log Retention
Log retention depends on whether you have an observability package enabled:
| Feature | With Observability Package | Without Package |
| ---------------- | ---------------------------- | ----------------------------- |
| **History** | 12 weeks complete | 24 hours maximum |
| **Volume** | Unlimited lines | Latest 1000 lines per service |
| **Capabilities** | Advanced filtering & metrics | Real-time only |
Configuration is available through cluster advanced settings.
## Nginx Logs
For publicly exposed applications, Nginx logs are also accessible through the same interface, displaying request management information.
## Next Steps
Review past deployments
Understand deployment statuses
Troubleshoot deployment issues
Advanced logging and monitoring
You can filter logs using:
* **Search by keyword**: Locate specific messages
* **Filter by time range**: Isolate specific periods
* **Filter by log level**: Prioritize by severity
* **Filter by pod**: View logs from specific instances
* **Filter by deployment ID**: Isolate logs from a specific deployment
#### Filter by Deployment ID
When troubleshooting a failed deployment, you can filter logs using the `deployment_id` to see only the logs produced during that specific deployment. This removes noise from other deployments and helps you get to the root cause faster.
To use this feature:
1. Navigate to the deployment history and find the deployment ID you want to investigate
2. Apply the deployment ID filter in the logs view
3. Review only the logs generated during that specific deployment's bootstrap process
When viewing deployment logs, clicking "Go to service logs" automatically applies the deployment ID filter, seamlessly transitioning you from deployment logs to the filtered service logs for that specific deployment.
This is especially useful when:
* A deployment fails during application startup
* You need to isolate issues from a specific deployment attempt
* Multiple deployments have occurred and you want to focus on one particular execution
## Log Retention
Log retention depends on whether you have an observability package enabled:
| Feature | With Observability Package | Without Package |
| ---------------- | ---------------------------- | ----------------------------- |
| **History** | 12 weeks complete | 24 hours maximum |
| **Volume** | Unlimited lines | Latest 1000 lines per service |
| **Capabilities** | Advanced filtering & metrics | Real-time only |
Configuration is available through cluster advanced settings.
## Nginx Logs
For publicly exposed applications, Nginx logs are also accessible through the same interface, displaying request management information.
## Next Steps
Review past deployments
Understand deployment statuses
Troubleshoot deployment issues
Advanced logging and monitoring